Algebra 1 Formula Flashcards (Free Visual Review)
Free visual flashcards for every Algebra 1 formula, grouped by topic: linear equations, slope, systems, quadratics, exponents, and factoring. Flip each card to check yourself, with no sign-up needed.
Free Algebra 1 formula flashcards with graphs, visual diagrams, and study notes for slope, systems, exponents, quadratics, functions, geometry, and probability.
Use this visual deck to review the rules students need most: line forms, inequalities, exponent rules, radicals, factoring, quadratics, functions, sequences, statistics, coordinate geometry, and graphing. Each card includes a formula or rule, a student-friendly explanation, and a visual when it helps the idea stick.
114formula and rule cards
10Algebra 1 topics
14graphing cards
Freeonline review with saved progress

What This Algebra 1 Formula Flashcard Deck Covers
This page is built for active Algebra 1 formula review. The flashcards are not just a list of formulas; they also include important restrictions such as nonzero denominators, real-number square-root conditions, and when a line has undefined slope.
| Topic | Cards | What students review |
|---|---|---|
| Number Sense & Proportions | 8 cards | Percents, proportions, unit rates, absolute value distance, and absolute value equations. |
| Linear Equations | 14 cards | Slope, intercepts, line forms, horizontal and vertical lines, and average rate of change. |
| Systems & Inequalities | 10 cards | Systems, substitution, elimination, compound inequalities, inequality graphs, and absolute value inequalities. |
| Exponents & Radicals | 13 cards | Exponent laws, roots, rational exponents, scientific notation, and square-root equations with restrictions. |
| Polynomials & Factoring | 13 cards | Distributive property, FOIL, special products, GCF, grouping, and AC-method factoring. |
| Quadratics | 12 cards | Standard form, quadratic formula, discriminant, vertex, factored form, roots, and y-intercepts. |
| Functions | 12 cards | Function notation, domain and range, direct and inverse variation, sequences, and exponential models. |
| Data & Probability | 8 cards | Mean, median, mode, range, probability, independent events, line of best fit, residuals, and correlation. |
| Geometry & Coordinate Formulas | 10 cards | Pythagorean theorem, distance, midpoint, area, circumference, and volume formulas. |
| Graphing | 14 cards | Coordinate-plane examples for lines, systems, inequalities, quadratics, functions, exponential models, scatter plots, and distance. |
Jump to an Algebra 1 Formula Topic
Number Sense & ProportionsLinear EquationsSystems & InequalitiesExponents & RadicalsPolynomials & FactoringQuadraticsFunctionsData & ProbabilityGeometry & Coordinate FormulasGraphing
Number Sense & Proportions
8 cards. Percents, proportions, unit rates, absolute value distance, and absolute value equations.
Linear Equations
14 cards. Slope, intercepts, line forms, horizontal and vertical lines, and average rate of change.
Systems & Inequalities
10 cards. Systems, substitution, elimination, compound inequalities, inequality graphs, and absolute value inequalities.
Exponents & Radicals
13 cards. Exponent laws, roots, rational exponents, scientific notation, and square-root equations with restrictions.
Polynomials & Factoring
13 cards. Distributive property, FOIL, special products, GCF, grouping, and AC-method factoring.
Quadratics
12 cards. Standard form, quadratic formula, discriminant, vertex, factored form, roots, and y-intercepts.
Functions
12 cards. Function notation, domain and range, direct and inverse variation, sequences, and exponential models.
Data & Probability
8 cards. Mean, median, mode, range, probability, independent events, line of best fit, residuals, and correlation.
Geometry & Coordinate Formulas
10 cards. Pythagorean theorem, distance, midpoint, area, circumference, and volume formulas.
Graphing
14 cards. Coordinate-plane examples for lines, systems, inequalities, quadratics, functions, exponential models, scatter plots, and distance.
How to Use These Algebra 1 Flashcards
1
Start with one topic
Choose a topic from the dropdown instead of trying to memorize every formula at once. Linear equations, quadratics, and exponents are strong starting points.
2
Flip, then mark
Read the front of the card, predict the formula or rule, then flip it. Mark Know it only when you can explain when the rule works.
3
Practice immediately
After reviewing a set, solve a few Algebra 1 problems using the formulas. Flashcards build recall; practice builds test confidence.
Best Order for Studying Algebra 1 Formulas
If a student feels overwhelmed, use this order: linear equations and slope, systems and inequalities, exponents and radicals, polynomials and factoring, quadratics, functions and sequences, data and probability, then geometry and coordinate formulas. This order moves from the formulas students use constantly to the formulas that often appear in later units and review tests.
Most Important Algebra 1 Formulas to Know First
- Slope: rise over run and slope between two points.
- Line forms: slope-intercept, point-slope, and standard form.
- Systems: substitution, elimination, and graph intersections.
- Inequalities: flip the inequality when multiplying or dividing by a negative.
- Exponent rules: product, quotient, power, zero, and negative exponents.
- Factoring: GCF, difference of squares, trinomials, and the AC method.
- Quadratics: quadratic formula, discriminant, vertex, factored form, and axis of symmetry.
- Functions: function notation, domain/range, sequences, and exponential growth or decay.
- Data: mean, median, mode, range, probability, and line of best fit.
- Coordinate geometry: distance, midpoint, Pythagorean theorem, area, circumference, and volume.
Common Algebra 1 Formula Mistakes These Cards Help Fix
- Forgetting that slope is undefined when the x-values are the same.
- Using intercept numbers instead of intercept points, such as writing only C/A instead of (C/A, 0).
- Applying exponent and radical rules without checking nonzero or nonnegative restrictions.
- Confusing the numbers in factors with the actual roots of a quadratic.
- Using the quadratic formula without remembering that a cannot be 0.
- Treating probability formulas as valid even when outcomes are not equally likely.
- Trying to graph a line from intercepts when both intercepts are the same point.
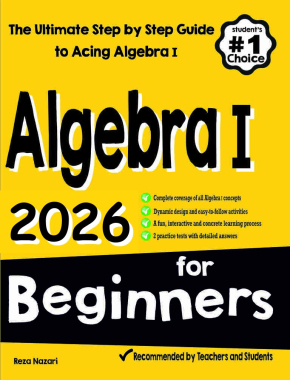
Algebra I for Beginners 2026
Recommended when a student needs more than formulas: a step-by-step Algebra I study path with examples, guided practice, and review after using the flashcards.
- Best next step for students who need a full Algebra 1 lesson path.
- Pairs naturally with the formula flashcards and Algebra 1 practice pages.
- Useful for rebuilding weak skills before classroom tests, EOC review, or STAAR Algebra I practice.
Frequently Asked Questions
What formulas are on an Algebra 1 formula sheet?
Most Algebra 1 formula sheets include slope m = (y₂ − y₁)/(x₂ − x₁), slope-intercept form y = mx + b, point-slope form, the quadratic formula x = [−b ± √(b² − 4ac)]/(2a), exponent rules, and area and volume formulas. These flashcards cover all of those plus restrictions, such as a ≠ 0 in a quadratic, that a plain list often leaves out.
Is there an Algebra 1 formula sheet PDF?
This Algebra 1 deck is an online flashcard set rather than a PDF, so you can flip, shuffle and track the formulas you miss. If you want a paper version, copy the cards you mark Review again onto one page. Writing your own sheet by hand is itself a strong way to memorize the formulas.
Is there a formula sheet for STAAR Algebra I?
Yes. Texas provides a mathematics reference sheet for the STAAR Algebra I test, with formulas such as slope, line forms and the quadratic formula. Practice with the official sheet so you know where each formula is. You still need to know when to use each rule, which is what these flashcards help you build.
Do you get a formula sheet on the Algebra 1 Regents?
New York provides a reference sheet for the Algebra I Regents exam, but it lists only some formulas, so you still need to know many rules by heart. Check the New York State Education Department site for the current sheet. Use these cards to master the line forms, factoring patterns and exponent rules it does not show.
Is there a formula sheet for the Algebra 1 EOC?
Many states give students a reference sheet on the Algebra 1 end-of-course exam, but the formulas included differ by state and change over time. Look up your state’s official reference sheet and compare it with these flashcards. Focus extra review on the formulas your state does not provide, such as factoring patterns.
All 114 Flashcards, Text Version
Every card from the deck above, listed as text so you can read, search, or print it without the flip player.
Number Sense & Proportions
| Front | Back |
|---|---|
| Percent formula | \[\text{part}=\frac{\text{percent}}{100}\cdot \text{whole}\]What it means: Use this for percent word problems. First identify the base, or whole, before calculating.How to use itName the part, whole, rate, or unit before calculating.Convert percents to decimals when multiplying.Check whether the answer is reasonable compared with the original amount. |
| Percent change | \[\text{percent change}=\frac{\text{new}-\text{old}}{\text{old}}\cdot 100\%\]What it means: A positive result is increase. A negative result is decrease.How to use itName the part, whole, rate, or unit before calculating.Convert percents to decimals when multiplying.Check whether the answer is reasonable compared with the original amount. |
| Simple interest | \[I=Prt\]What it means: P is principal, r is annual rate as a decimal, and t is time in years.How to use itName the part, whole, rate, or unit before calculating.Convert percents to decimals when multiplying.Check whether the answer is reasonable compared with the original amount. |
| Proportion cross products | \[\frac{a}{b}=\frac{c}{d}\quad\Longrightarrow\quad ad=bc\]What it means: Use cross products to solve equivalent-ratio problems.How to use itName the part, whole, rate, or unit before calculating.Convert percents to decimals when multiplying.Check whether the answer is reasonable compared with the original amount. |
| Unit rate | \[\text{unit rate}=\frac{\text{amount}}{\text{number of units}}\]What it means: Divide the total amount by the number of units to find the amount per 1 unit.How to use itName the part, whole, rate, or unit before calculating.Convert percents to decimals when multiplying.Check whether the answer is reasonable compared with the original amount. |
| Absolute value as distance | \[|x-a|=\text{distance between }x\text{ and }a\]What it means: Absolute value measures distance, so it is never negative.How to use itName the part, whole, rate, or unit before calculating.Convert percents to decimals when multiplying.Check whether the answer is reasonable compared with the original amount. |
| Absolute value equation | \[|x-a|=d,\ d>0\quad\Longrightarrow\quad x-a=d\ \text{ or }\ x-a=-d\]What it means: If d > 0, split into two equations. If d = 0, there is one solution. If d < 0, there is no solution.How to use itName the part, whole, rate, or unit before calculating.Convert percents to decimals when multiplying.Check whether the answer is reasonable compared with the original amount. |
| Order of operations | Work in this order: grouping symbols, exponents, multiplication/division from left to right, then addition/subtraction from left to right.Study moveName the part, whole, rate, or unit before calculating.Convert percents to decimals when multiplying.Check whether the answer is reasonable compared with the original amount. |
Linear Equations
| Front | Back |
|---|---|
| Solve a two-step linear equation | \[ax+b=c,\ a\ne0\quad\Longrightarrow\quad x=\frac{c-b}{a}\]What it means: Undo addition or subtraction first, then undo multiplication or division. The coefficient a cannot be 0 because division by 0 is undefined.How to use itIdentify whether the problem asks you to solve an equation, find slope, or write or graph a line.Keep equation operations balanced; for graphing, label slope and intercepts before drawing.Check by substituting the result into the original equation or by testing a point on the line. |
| Slope between two points | \[m=\frac{y_2-y_1}{x_2-x_1},\quad x_2\ne x_1\]What it means: Slope is rise over run. Use the same point order on top and bottom. If \(x_2=x_1\), the line is vertical and the slope is undefined.How to use itIdentify whether the problem asks you to solve an equation, find slope, or write or graph a line.Keep equation operations balanced; for graphing, label slope and intercepts before drawing.Check by substituting the result into the original equation or by testing a point on the line. |
| Slope-intercept form | \[y=mx+b\]What it means: m is the slope and b is the y-intercept.How to use itIdentify whether the problem asks you to solve an equation, find slope, or write or graph a line.Keep equation operations balanced; for graphing, label slope and intercepts before drawing.Check by substituting the result into the original equation or by testing a point on the line. |
| Point-slope form | \[y-y_1=m(x-x_1)\]What it means: Use this when you know one point and the slope.How to use itIdentify whether the problem asks you to solve an equation, find slope, or write or graph a line.Keep equation operations balanced; for graphing, label slope and intercepts before drawing.Check by substituting the result into the original equation or by testing a point on the line. |
| Standard form of a line | \[Ax+By=C\]What it means: A, B, and C are usually integers. This form makes intercepts easy.How to use itIdentify whether the problem asks you to solve an equation, find slope, or write or graph a line.Keep equation operations balanced; for graphing, label slope and intercepts before drawing.Check by substituting the result into the original equation or by testing a point on the line. |
| Slope from standard form | \[Ax+By=C,\ B\ne0\quad\Longrightarrow\quad m=-\frac{A}{B}\]What it means: For Ax + By = C, solve for y to see the slope. If B = 0, the line is vertical and its slope is undefined.How to use itIdentify whether the problem asks you to solve an equation, find slope, or write or graph a line.Keep equation operations balanced; for graphing, label slope and intercepts before drawing.Check by substituting the result into the original equation or by testing a point on the line. |
| Intercepts from standard form | \[x\text{-intercept}=\left(\frac{C}{A},0\right),\ A\ne0\qquad y\text{-intercept}=\left(0,\frac{C}{B}\right),\ B\ne0\]What it means: For the x-intercept, set y = 0. For the y-intercept, set x = 0.How to use itIdentify whether the problem asks you to solve an equation, find slope, or write or graph a line.Keep equation operations balanced; for graphing, label slope and intercepts before drawing.Check by substituting the result into the original equation or by testing a point on the line. |
| Find intercepts by substitution | \[x\text{-intercept: set }y=0,\qquad y\text{-intercept: set }x=0\]What it means: This method works for more than just lines.How to use itIdentify whether the problem asks you to solve an equation, find slope, or write or graph a line.Keep equation operations balanced; for graphing, label slope and intercepts before drawing.Check by substituting the result into the original equation or by testing a point on the line. |
| Horizontal line | \[y=k\]What it means: Horizontal lines have slope 0.How to use itIdentify whether the problem asks you to solve an equation, find slope, or write or graph a line.Keep equation operations balanced; for graphing, label slope and intercepts before drawing.Check by substituting the result into the original equation or by testing a point on the line. |
| Vertical line | \[x=k\]What it means: Vertical lines have undefined slope.How to use itIdentify whether the problem asks you to solve an equation, find slope, or write or graph a line.Keep equation operations balanced; for graphing, label slope and intercepts before drawing.Check by substituting the result into the original equation or by testing a point on the line. |
| Average rate of change | \[\frac{\Delta y}{\Delta x}=\frac{f(b)-f(a)}{b-a},\quad a\ne b\]What it means: For a linear function, this is the slope. The inputs must be different so the denominator is not 0.How to use itIdentify whether the problem asks you to solve an equation, find slope, or write or graph a line.Keep equation operations balanced; for graphing, label slope and intercepts before drawing.Check by substituting the result into the original equation or by testing a point on the line. |
| Parallel slopes | Nonvertical parallel lines have equal slopes: \(m_1=m_2\). Vertical lines are also parallel to each other, but their slopes are undefined.Study moveIdentify whether the problem asks you to solve an equation, find slope, or write or graph a line.Keep equation operations balanced; for graphing, label slope and intercepts before drawing.Check by substituting the result into the original equation or by testing a point on the line. |
| Perpendicular slopes | For nonvertical, nonhorizontal lines, perpendicular slopes are negative reciprocals: \(m_1m_2=-1\). A horizontal line is perpendicular to a vertical line.Study moveIdentify whether the problem asks you to solve an equation, find slope, or write or graph a line.Keep equation operations balanced; for graphing, label slope and intercepts before drawing.Check by substituting the result into the original equation or by testing a point on the line. |
| Linear function | \[f(x)=mx+b\]What it means: The input is x, the output is f(x), and the graph is a line.How to use itIdentify whether the problem asks you to solve an equation, find slope, or write or graph a line.Keep equation operations balanced; for graphing, label slope and intercepts before drawing.Check by substituting the result into the original equation or by testing a point on the line. |
Systems & Inequalities
| Front | Back |
|---|---|
| Solution to a system | \[\begin{cases}y=m_1x+b_1\\y=m_2x+b_2\end{cases}\]What it means: The solution is the point where both equations are true at the same time.How to use itTurn each sentence or equation into a boundary, line, or interval.Graph or solve each part carefully, then look for the overlap or intersection.Check the solution in the original statement, especially for inequalities. |
| One, none, or infinitely many system solutions | Intersecting lines: one solution. Parallel lines: no solution. Same line: infinitely many solutions.Study moveTurn each sentence or equation into a boundary, line, or interval.Graph or solve each part carefully, then look for the overlap or intersection.Check the solution in the original statement, especially for inequalities. |
| Substitution method | Solve one equation for one variable, substitute into the other equation, then solve.Study moveTurn each sentence or equation into a boundary, line, or interval.Graph or solve each part carefully, then look for the overlap or intersection.Check the solution in the original statement, especially for inequalities. |
| Elimination method | Add or subtract equations so one variable cancels. Multiply an equation first if needed.Study moveTurn each sentence or equation into a boundary, line, or interval.Graph or solve each part carefully, then look for the overlap or intersection.Check the solution in the original statement, especially for inequalities. |
| Inequality flip rule | When multiplying or dividing both sides by a negative number, reverse the inequality sign.Study moveTurn each sentence or equation into a boundary, line, or interval.Graph or solve each part carefully, then look for the overlap or intersection.Check the solution in the original statement, especially for inequalities. |
| Compound inequality with AND | \[a<x\le b\]What it means: AND means the overlap of the two conditions.How to use itTurn each sentence or equation into a boundary, line, or interval.Graph or solve each part carefully, then look for the overlap or intersection.Check the solution in the original statement, especially for inequalities. |
| Compound inequality with OR | \[x<a\ \text{ or }\ x>b\]What it means: OR often creates two separated rays on a number line.How to use itTurn each sentence or equation into a boundary, line, or interval.Graph or solve each part carefully, then look for the overlap or intersection.Check the solution in the original statement, especially for inequalities. |
| Graph a linear inequality | Use a solid boundary for \(\le\) or \(\ge\). Use a dashed boundary for \(<\) or \(>\). Then shade the solution region.Study moveTurn each sentence or equation into a boundary, line, or interval.Graph or solve each part carefully, then look for the overlap or intersection.Check the solution in the original statement, especially for inequalities. |
| Absolute value inequality: less than | \[|x-a|<d,\ d>0\quad\Longrightarrow\quad a-d<x<a+d\]What it means: Less than means the solution is inside the distance interval. Use the same pattern with less-than-or-equal when the inequality includes equality.How to use itTurn each sentence or equation into a boundary, line, or interval.Graph or solve each part carefully, then look for the overlap or intersection.Check the solution in the original statement, especially for inequalities. |
| Absolute value inequality: greater than | \[|x-a|>d,\ d>0\quad\Longrightarrow\quad x<a-d\ \text{ or }\ x>a+d\]What it means: Greater than means the solution is outside the distance interval. Use the same pattern with greater-than-or-equal when the inequality includes equality.How to use itTurn each sentence or equation into a boundary, line, or interval.Graph or solve each part carefully, then look for the overlap or intersection.Check the solution in the original statement, especially for inequalities. |
Exponents & Radicals
| Front | Back |
|---|---|
| Product rule | \[x^a\cdot x^b=x^{a+b}\]What it means: Same base: add exponents.How to use itMake sure the bases match before using exponent rules.Apply one rule at a time and rewrite negative exponents as fractions.Simplify radicals by pulling out perfect-square factors. |
| Quotient rule | \[\frac{x^a}{x^b}=x^{a-b},\quad x\ne0\]What it means: Same nonzero base: subtract exponents.How to use itMake sure the bases match before using exponent rules.Apply one rule at a time and rewrite negative exponents as fractions.Simplify radicals by pulling out perfect-square factors. |
| Power of a power | \[(x^a)^b=x^{ab}\]What it means: Multiply the exponents.How to use itMake sure the bases match before using exponent rules.Apply one rule at a time and rewrite negative exponents as fractions.Simplify radicals by pulling out perfect-square factors. |
| Power of a product | \[(ab)^n=a^n b^n\]What it means: Distribute the exponent to every factor inside the parentheses.How to use itMake sure the bases match before using exponent rules.Apply one rule at a time and rewrite negative exponents as fractions.Simplify radicals by pulling out perfect-square factors. |
| Power of a quotient | \[\left(\frac{a}{b}\right)^n=\frac{a^n}{b^n},\quad b\ne0\]What it means: Distribute the exponent to numerator and denominator. The denominator cannot be 0.How to use itMake sure the bases match before using exponent rules.Apply one rule at a time and rewrite negative exponents as fractions.Simplify radicals by pulling out perfect-square factors. |
| Zero exponent | \[x^0=1\quad(x\ne0)\]What it means: Any nonzero base to the zero power equals 1.How to use itMake sure the bases match before using exponent rules.Apply one rule at a time and rewrite negative exponents as fractions.Simplify radicals by pulling out perfect-square factors. |
| Negative exponent | \[x^{-n}=\frac{1}{x^n},\quad x\ne0\]What it means: A negative exponent moves the factor to the other side of the fraction. The base cannot be 0.How to use itMake sure the bases match before using exponent rules.Apply one rule at a time and rewrite negative exponents as fractions.Simplify radicals by pulling out perfect-square factors. |
| Fractional exponent | \[x^{1/n}=\sqrt[n]{x}\]What it means: A denominator in the exponent becomes a root. For even roots in the real-number system, the radicand must be nonnegative.How to use itMake sure the bases match before using exponent rules.Apply one rule at a time and rewrite negative exponents as fractions.Simplify radicals by pulling out perfect-square factors. |
| Rational exponent | \[x^{m/n}=\sqrt[n]{x^m}=(\sqrt[n]{x})^m\]What it means: The numerator is a power, and the denominator is a root. For even roots in the real-number system, use nonnegative radicands.How to use itMake sure the bases match before using exponent rules.Apply one rule at a time and rewrite negative exponents as fractions.Simplify radicals by pulling out perfect-square factors. |
| Square root product rule | \[\sqrt{ab}=\sqrt a\sqrt b,\quad a\ge0,\ b\ge0\]What it means: Use this to pull perfect-square factors out of a radical when the factors are nonnegative.How to use itMake sure the bases match before using exponent rules.Apply one rule at a time and rewrite negative exponents as fractions.Simplify radicals by pulling out perfect-square factors. |
| Square root quotient rule | \[\sqrt{\frac{a}{b}}=\frac{\sqrt a}{\sqrt b},\quad a\ge0,\ b>0\]What it means: Use when a is nonnegative and b is positive.How to use itMake sure the bases match before using exponent rules.Apply one rule at a time and rewrite negative exponents as fractions.Simplify radicals by pulling out perfect-square factors. |
| Scientific notation | \[a\times10^n,\quad 1\le |a|<10\]What it means: For positive numbers, \(1\le a<10\). For negative numbers, the coefficient is negative and \(1\le |a|<10\).How to use itMake sure the bases match before using exponent rules.Apply one rule at a time and rewrite negative exponents as fractions.Simplify radicals by pulling out perfect-square factors. |
| Square root equation check | \[x^2=a,\ a\ge0\quad\Longrightarrow\quad x=\pm\sqrt a\]What it means: If a > 0, there are two real solutions. If a = 0, there is one real solution. If a < 0, there is no real solution in Algebra 1’s real-number system.How to use itMake sure the bases match before using exponent rules.Apply one rule at a time and rewrite negative exponents as fractions.Simplify radicals by pulling out perfect-square factors. |
Polynomials & Factoring
| Front | Back |
|---|---|
| Degree of a polynomial | The degree is the highest exponent after the polynomial is simplified.Study moveLook for a greatest common factor first.Choose the factoring pattern that matches the expression.Multiply the factors mentally to check that you get the original polynomial. |
| Standard form of a polynomial | Write terms from highest degree to lowest degree.Study moveLook for a greatest common factor first.Choose the factoring pattern that matches the expression.Multiply the factors mentally to check that you get the original polynomial. |
| Distributive property | \[a(b+c)=ab+ac\]What it means: Use it forward to multiply and backward to factor.How to use itLook for a greatest common factor first.Choose the factoring pattern that matches the expression.Multiply the factors mentally to check that you get the original polynomial. |
| Combine like terms | \[ax+bx=(a+b)x\]What it means: Only combine terms with the same variable part.How to use itLook for a greatest common factor first.Choose the factoring pattern that matches the expression.Multiply the factors mentally to check that you get the original polynomial. |
| Monomial times polynomial | \[a(b+c+d)=ab+ac+ad\]What it means: Distribute the monomial to every term.How to use itLook for a greatest common factor first.Choose the factoring pattern that matches the expression.Multiply the factors mentally to check that you get the original polynomial. |
| FOIL / binomial multiplication | \[(a+b)(c+d)=ac+ad+bc+bd\]What it means: Multiply every term in the first binomial by every term in the second.How to use itLook for a greatest common factor first.Choose the factoring pattern that matches the expression.Multiply the factors mentally to check that you get the original polynomial. |
| Square of a sum | \[(a+b)^2=a^2+2ab+b^2\]What it means: The middle term is twice the product.How to use itLook for a greatest common factor first.Choose the factoring pattern that matches the expression.Multiply the factors mentally to check that you get the original polynomial. |
| Square of a difference | \[(a-b)^2=a^2-2ab+b^2\]What it means: Watch the sign of the middle term.How to use itLook for a greatest common factor first.Choose the factoring pattern that matches the expression.Multiply the factors mentally to check that you get the original polynomial. |
| Difference of squares | \[a^2-b^2=(a+b)(a-b)\]What it means: Works for subtraction of two squares, not addition.How to use itLook for a greatest common factor first.Choose the factoring pattern that matches the expression.Multiply the factors mentally to check that you get the original polynomial. |
| Factor out the GCF | \[ab+ac=a(b+c)\]What it means: Always look for a common factor first.How to use itLook for a greatest common factor first.Choose the factoring pattern that matches the expression.Multiply the factors mentally to check that you get the original polynomial. |
| Factoring by grouping | \[ax+ay+bx+by=a(x+y)+b(x+y)=(a+b)(x+y)\]What it means: Group terms so a common binomial appears.How to use itLook for a greatest common factor first.Choose the factoring pattern that matches the expression.Multiply the factors mentally to check that you get the original polynomial. |
| Factoring x^2 + bx + c | \[x^2+bx+c=(x+m)(x+n)\]What it means: Find m and n so m + n = b and mn = c.How to use itLook for a greatest common factor first.Choose the factoring pattern that matches the expression.Multiply the factors mentally to check that you get the original polynomial. |
| Factoring ax^2 + bx + c | \[ax^2+bx+c:\quad \text{find }p\text{ and }q\text{ such that }p+q=b\text{ and }pq=ac\]What it means: After checking for a GCF, use the AC method: find two numbers with product ac and sum b, rewrite the middle term, then factor by grouping.How to use itLook for a greatest common factor first.Choose the factoring pattern that matches the expression.Multiply the factors mentally to check that you get the original polynomial. |
Quadratics
| Front | Back |
|---|---|
| Quadratic standard form | \[y=ax^2+bx+c,\quad a\ne0\]What it means: The graph is a parabola. If a > 0 it opens up; if a < 0 it opens down.How to use itChoose the form that reveals what you need: standard, vertex, or factored.Use the graph to connect roots, vertex, axis of symmetry, and y-intercept.Check solutions by substituting them back into the quadratic. |
| Quadratic formula | \[x=\frac{-b\pm\sqrt{b^2-4ac}}{2a},\quad a\ne0\]What it means: Solves ax^2 + bx + c = 0, where a is not 0.How to use itChoose the form that reveals what you need: standard, vertex, or factored.Use the graph to connect roots, vertex, axis of symmetry, and y-intercept.Check solutions by substituting them back into the quadratic. |
| Discriminant | \[D=b^2-4ac\]What it means: D > 0: two real solutions. D = 0: one real solution, also called a double root. D < 0: no real solutions.How to use itChoose the form that reveals what you need: standard, vertex, or factored.Use the graph to connect roots, vertex, axis of symmetry, and y-intercept.Check solutions by substituting them back into the quadratic. |
| Axis of symmetry | \[x=-\frac{b}{2a},\quad a\ne0\]What it means: This vertical line passes through the vertex.How to use itChoose the form that reveals what you need: standard, vertex, or factored.Use the graph to connect roots, vertex, axis of symmetry, and y-intercept.Check solutions by substituting them back into the quadratic. |
| Vertex from standard form | \[h=-\frac{b}{2a},\quad a\ne0,\qquad k=f(h)\]What it means: The vertex is (h, k). Substitute h into the function to find k.How to use itChoose the form that reveals what you need: standard, vertex, or factored.Use the graph to connect roots, vertex, axis of symmetry, and y-intercept.Check solutions by substituting them back into the quadratic. |
| Vertex form | \[y=a(x-h)^2+k,\quad a\ne0\]What it means: The vertex is (h, k).How to use itChoose the form that reveals what you need: standard, vertex, or factored.Use the graph to connect roots, vertex, axis of symmetry, and y-intercept.Check solutions by substituting them back into the quadratic. |
| Factored form | \[y=a(x-r)(x-s),\quad a\ne0\]What it means: The x-intercepts are r and s.How to use itChoose the form that reveals what you need: standard, vertex, or factored.Use the graph to connect roots, vertex, axis of symmetry, and y-intercept.Check solutions by substituting them back into the quadratic. |
| Zero-product property | If \(ab=0\), then \(a=0\) or \(b=0\). Use this after factoring.Study moveChoose the form that reveals what you need: standard, vertex, or factored.Use the graph to connect roots, vertex, axis of symmetry, and y-intercept.Check solutions by substituting them back into the quadratic. |
| Complete the square pattern | \[x^2+bx+\left(\frac b2\right)^2=\left(x+\frac b2\right)^2\]What it means: Add half of b squared to create a perfect-square trinomial.How to use itChoose the form that reveals what you need: standard, vertex, or factored.Use the graph to connect roots, vertex, axis of symmetry, and y-intercept.Check solutions by substituting them back into the quadratic. |
| Y-intercept of a quadratic | \[y=ax^2+bx+c\quad\Longrightarrow\quad y\text{-intercept}=(0,c)\]What it means: Set x = 0 to find where the parabola crosses the y-axis.How to use itChoose the form that reveals what you need: standard, vertex, or factored.Use the graph to connect roots, vertex, axis of symmetry, and y-intercept.Check solutions by substituting them back into the quadratic. |
| Minimum or maximum of a quadratic | If \(a>0\), the vertex is a minimum. If \(a<0\), the vertex is a maximum.Study moveChoose the form that reveals what you need: standard, vertex, or factored.Use the graph to connect roots, vertex, axis of symmetry, and y-intercept.Check solutions by substituting them back into the quadratic. |
| Root relationships | \[x^2+bx+c=0:\quad r+s=-b,\quad rs=c\]What it means: For monic quadratics, roots add to -b and multiply to c. Do not confuse the roots with the numbers in the factors: if x^2 + bx + c = (x + m)(x + n), then the roots are -m and -n.How to use itChoose the form that reveals what you need: standard, vertex, or factored.Use the graph to connect roots, vertex, axis of symmetry, and y-intercept.Check solutions by substituting them back into the quadratic. |
Functions
| Front | Back |
|---|---|
| Function notation | \(f(x)\) means the output of function f when the input is x. To find \(f(3)\), substitute 3 for x.Study moveIdentify the input and output before calculating.Use a table or graph to see the pattern.Check whether each input has exactly one output. |
| Domain and range | Domain = possible input values. Range = possible output values.Study moveIdentify the input and output before calculating.Use a table or graph to see the pattern.Check whether each input has exactly one output. |
| Vertical line test | A graph is a function if every vertical line touches it at most once.Study moveIdentify the input and output before calculating.Use a table or graph to see the pattern.Check whether each input has exactly one output. |
| Direct variation | \[y=kx\]What it means: k is the constant of variation, and the graph passes through the origin.How to use itIdentify the input and output before calculating.Use a table or graph to see the pattern.Check whether each input has exactly one output. |
| Inverse variation | \[y=\frac{k}{x}\quad\text{or}\quad xy=k\]What it means: When k > 0 and x > 0, as x increases, y decreases. The product xy = k stays constant.How to use itIdentify the input and output before calculating.Use a table or graph to see the pattern.Check whether each input has exactly one output. |
| Arithmetic sequence explicit formula | \[a_n=a_1+(n-1)d\]What it means: d is the common difference. This formula assumes n = 1 gives the first term.How to use itIdentify the input and output before calculating.Use a table or graph to see the pattern.Check whether each input has exactly one output. |
| Arithmetic sequence recursive formula | \[a_n=a_{n-1}+d,\quad \text{with a given starting value such as }a_1\]What it means: Use the previous term plus the common difference. A recursive formula must include a starting term.How to use itIdentify the input and output before calculating.Use a table or graph to see the pattern.Check whether each input has exactly one output. |
| Geometric sequence explicit formula | \[a_n=a_1r^{n-1}\]What it means: r is the common ratio. This formula assumes n = 1 gives the first term.How to use itIdentify the input and output before calculating.Use a table or graph to see the pattern.Check whether each input has exactly one output. |
| Geometric sequence recursive formula | \[a_n=r\cdot a_{n-1},\quad \text{with a given starting value such as }a_1\]What it means: Multiply the previous term by the common ratio. A recursive formula must include a starting term.How to use itIdentify the input and output before calculating.Use a table or graph to see the pattern.Check whether each input has exactly one output. |
| Exponential function | \[y=ab^x,\quad a\ne0,\ b>0,\ b\ne1\]What it means: a is the starting value and b is the growth or decay factor.How to use itIdentify the input and output before calculating.Use a table or graph to see the pattern.Check whether each input has exactly one output. |
| Exponential growth | \[y=a(1+r)^x\]What it means: Use when the percent rate r is positive and written as a decimal.How to use itIdentify the input and output before calculating.Use a table or graph to see the pattern.Check whether each input has exactly one output. |
| Exponential decay | \[y=a(1-r)^x,\quad 0<r<1\]What it means: Use when the percent rate r is a decrease written as a decimal.How to use itIdentify the input and output before calculating.Use a table or graph to see the pattern.Check whether each input has exactly one output. |
Data & Probability
| Front | Back |
|---|---|
| Mean | \[\text{mean}=\frac{\text{sum of values}}{\text{number of values}}\]What it means: Add all values, then divide by how many values there are.How to use itIdentify whether you are summarizing data, reading a graph, or counting outcomes.For data, order and label values; for probability, label favorable and total outcomes.Interpret the answer in words and check that it is reasonable. |
| Median, mode, and range | Median = middle value after the data are ordered. If there are two middle values, average them. Mode = most frequent value; a data set may have one mode, more than one mode, or no mode. Range = maximum minus minimum.Study moveIdentify whether you are summarizing data, reading a graph, or counting outcomes.For data, order and label values; for probability, label favorable and total outcomes.Interpret the answer in words and check that it is reasonable. |
| Probability | \[P(\text{event})=\frac{\text{favorable outcomes}}{\text{total outcomes}}\]What it means: Use this formula when all outcomes are equally likely. Probability is between 0 and 1, inclusive.How to use itIdentify whether you are summarizing data, reading a graph, or counting outcomes.For data, order and label values; for probability, label favorable and total outcomes.Interpret the answer in words and check that it is reasonable. |
| Complement probability | \[P(\text{not }A)=1-P(A)\]What it means: The event and its complement add to 1.How to use itIdentify whether you are summarizing data, reading a graph, or counting outcomes.For data, order and label values; for probability, label favorable and total outcomes.Interpret the answer in words and check that it is reasonable. |
| Independent events | \[P(A\text{ and }B)=P(A)\cdot P(B)\]What it means: Use this when events A and B are independent, meaning one event does not affect the other.How to use itIdentify whether you are summarizing data, reading a graph, or counting outcomes.For data, order and label values; for probability, label favorable and total outcomes.Interpret the answer in words and check that it is reasonable. |
| Line of best fit | \[\hat y=mx+b\]What it means: Use a trend line to predict y from x.How to use itIdentify whether you are summarizing data, reading a graph, or counting outcomes.For data, order and label values; for probability, label favorable and total outcomes.Interpret the answer in words and check that it is reasonable. |
| Residual | \[\text{residual}=\text{actual }y-\text{predicted }y\]What it means: A positive residual means the data point is above the prediction line.How to use itIdentify whether you are summarizing data, reading a graph, or counting outcomes.For data, order and label values; for probability, label favorable and total outcomes.Interpret the answer in words and check that it is reasonable. |
| Correlation direction | Positive correlation rises left to right. Negative correlation falls left to right. No correlation has no clear trend.Study moveIdentify whether you are summarizing data, reading a graph, or counting outcomes.For data, order and label values; for probability, label favorable and total outcomes.Interpret the answer in words and check that it is reasonable. |
Geometry & Coordinate Formulas
| Front | Back |
|---|---|
| Pythagorean theorem | \[a^2+b^2=c^2\]What it means: Use only for right triangles. c is the hypotenuse.How to use itDraw and label the shape or coordinate points first.Choose the formula that matches the labeled parts.Check units: length, square units, or cubic units. |
| Distance formula | \[d=\sqrt{(x_2-x_1)^2+(y_2-y_1)^2}\]What it means: This is the Pythagorean theorem on the coordinate plane.How to use itDraw and label the shape or coordinate points first.Choose the formula that matches the labeled parts.Check units: length, square units, or cubic units. |
| Midpoint formula | \[\left(\frac{x_1+x_2}{2},\frac{y_1+y_2}{2}\right)\]What it means: Average the x-values and average the y-values.How to use itDraw and label the shape or coordinate points first.Choose the formula that matches the labeled parts.Check units: length, square units, or cubic units. |
| Rectangle area | \[A=lw\]What it means: Multiply length by width.How to use itDraw and label the shape or coordinate points first.Choose the formula that matches the labeled parts.Check units: length, square units, or cubic units. |
| Triangle area | \[A=\frac12 bh\]What it means: Use base times height, then divide by 2.How to use itDraw and label the shape or coordinate points first.Choose the formula that matches the labeled parts.Check units: length, square units, or cubic units. |
| Trapezoid area | \[A=\frac12(b_1+b_2)h\]What it means: Add the two bases, multiply by height, then divide by 2.How to use itDraw and label the shape or coordinate points first.Choose the formula that matches the labeled parts.Check units: length, square units, or cubic units. |
| Circle area | \[A=\pi r^2\]What it means: Use radius, not diameter.How to use itDraw and label the shape or coordinate points first.Choose the formula that matches the labeled parts.Check units: length, square units, or cubic units. |
| Circle circumference | \[C=2\pi r=\pi d\]What it means: Circumference is distance around the circle.How to use itDraw and label the shape or coordinate points first.Choose the formula that matches the labeled parts.Check units: length, square units, or cubic units. |
| Rectangular prism volume | \[V=lwh\]What it means: Multiply length, width, and height.How to use itDraw and label the shape or coordinate points first.Choose the formula that matches the labeled parts.Check units: length, square units, or cubic units. |
| Cylinder volume | \[V=\pi r^2h\]What it means: Area of the circular base times height.How to use itDraw and label the shape or coordinate points first.Choose the formula that matches the labeled parts.Check units: length, square units, or cubic units. |
Graphing
| Front | Back |
|---|---|
| Graph slope-intercept form | \[y=mx+b\]What it means: Start at the y-intercept b. From that point, use the slope m as rise over run. The graph below shows y = x + 1, so it crosses the y-axis at 1 and rises 1 for every run of 1.How to use itMark the key features first: intercept, slope, vertex, boundary, or asymptote.Draw the graph from those features, not from random points only.Check one point or table value so the graph matches the rule. |
| Graph a line from two points | \[m=\frac{y_2-y_1}{x_2-x_1}\]What it means: Plot both points, draw the line through them, then compute slope to describe the line. The slope triangle on the graph shows the rise and run visually.How to use itMark the key features first: intercept, slope, vertex, boundary, or asymptote.Draw the graph from those features, not from random points only.Check one point or table value so the graph matches the rule. |
| Graph standard form by intercepts | \[Ax+By=C\]What it means: Set y = 0 to find the x-intercept. Set x = 0 to find the y-intercept. Plot both intercepts, then draw the line. If both intercepts are the same point, such as (0, 0), find one additional point before drawing the line.How to use itMark the key features first: intercept, slope, vertex, boundary, or asymptote.Draw the graph from those features, not from random points only.Check one point or table value so the graph matches the rule. |
| Graph a system of equations | \[\begin{cases} y=x+1\\ y=-2x+4\end{cases}\]What it means: Graph both lines on the same coordinate plane. The intersection point is the solution because it makes both equations true.How to use itMark the key features first: intercept, slope, vertex, boundary, or asymptote.Draw the graph from those features, not from random points only.Check one point or table value so the graph matches the rule. |
| Graph a linear inequality | \[y>-\frac12x+1\]What it means: Draw the boundary line first. Because the symbol is >, use a dashed line. Shade above the line because y is greater than the boundary value.How to use itMark the key features first: intercept, slope, vertex, boundary, or asymptote.Draw the graph from those features, not from random points only.Check one point or table value so the graph matches the rule. |
| Graph an absolute value function | \[y=|x+1|\]What it means: The graph is a V. Find the vertex by setting the inside expression equal to zero, then draw both arms with slope 1 and -1.How to use itMark the key features first: intercept, slope, vertex, boundary, or asymptote.Draw the graph from those features, not from random points only.Check one point or table value so the graph matches the rule. |
| Graph a quadratic from standard form | \[y=x^2-2x-3\]What it means: Find the axis of symmetry, vertex, y-intercept, and zeros if possible. The graph below shows how these features shape the parabola.How to use itMark the key features first: intercept, slope, vertex, boundary, or asymptote.Draw the graph from those features, not from random points only.Check one point or table value so the graph matches the rule. |
| Graph a quadratic from factored form | \[y=a(x-r)(x-s),\quad a\ne0\]What it means: Factored form gives the x-intercepts immediately: r and s. Plot the zeros, find the midpoint for the axis of symmetry, then sketch the parabola.How to use itMark the key features first: intercept, slope, vertex, boundary, or asymptote.Draw the graph from those features, not from random points only.Check one point or table value so the graph matches the rule. |
| Use the discriminant to predict the graph | \[D=b^2-4ac\]What it means: The discriminant tells how many x-intercepts the parabola has: if D > 0, it crosses the x-axis twice; if D = 0, it touches the x-axis once; if D < 0, it has no real x-intercepts.How to use itMark the key features first: intercept, slope, vertex, boundary, or asymptote.Draw the graph from those features, not from random points only.Check one point or table value so the graph matches the rule. |
| Use the vertical line test | \[\text{one input}\rightarrow\text{one output}\]What it means: A relation is a function only if every vertical line hits the graph at most once. If a vertical line hits twice, one x-value has two outputs.How to use itMark the key features first: intercept, slope, vertex, boundary, or asymptote.Draw the graph from those features, not from random points only.Check one point or table value so the graph matches the rule. |
| Graph inverse variation | \[y=\frac{k}{x}\]What it means: The graph has two curved branches. It gets close to the axes but does not cross them when k is nonzero.How to use itMark the key features first: intercept, slope, vertex, boundary, or asymptote.Draw the graph from those features, not from random points only.Check one point or table value so the graph matches the rule. |
| Graph exponential growth and decay | \[\text{Growth: }y=a(1+r)^x\qquad \text{Decay: }y=a(1-r)^x,\quad 0<r<1\]What it means: Use + for growth and – for decay. The rate r must be written as a decimal. A table of values helps students sketch the curve accurately.How to use itMark the key features first: intercept, slope, vertex, boundary, or asymptote.Draw the graph from those features, not from random points only.Check one point or table value so the graph matches the rule. |
| Read a scatter plot and trend line | \[\hat y=mx+b\]What it means: The line of best fit shows the overall trend. The slope describes the predicted change in y for each 1-unit increase in x.How to use itMark the key features first: intercept, slope, vertex, boundary, or asymptote.Draw the graph from those features, not from random points only.Check one point or table value so the graph matches the rule. |
| Graph distance between two points | \[d=\sqrt{(x_2-x_1)^2+(y_2-y_1)^2}\]What it means: Draw the horizontal and vertical legs between the two points. The distance formula is the Pythagorean theorem on that right triangle.How to use itMark the key features first: intercept, slope, vertex, boundary, or asymptote.Draw the graph from those features, not from random points only.Check one point or table value so the graph matches the rule. |
Explore more free review tools in our math flashcards hub and the full Algebra 1 learning hub.

Related to This Article
More math articles
- The Best Grade 5 ELA Practice Tests for Delaware Students
- Chapter 20: Freedom of Speech and Press
- The Best Algebra 1 Book for California Students
- FREE 8th Grade Common Core Math Practice Test
- 5th Grade MCAP Math Worksheets: FREE & Printable
- Derivative Calculator — Differentiate Step by Step (Free)
- Number Properties Puzzle – Challenge 19
- Free Louisiana Grade 2 English Worksheets
- The Ultimate SAT Math Formula Cheat Sheet
- 4th Grade MCAS Math FREE Sample Practice Questions

What people say about "Algebra 1 Formula Flashcards (Free Visual Review) - Effortless Math"?
No one replied yet.