Genetic Variation: How to Understand Population Diversity
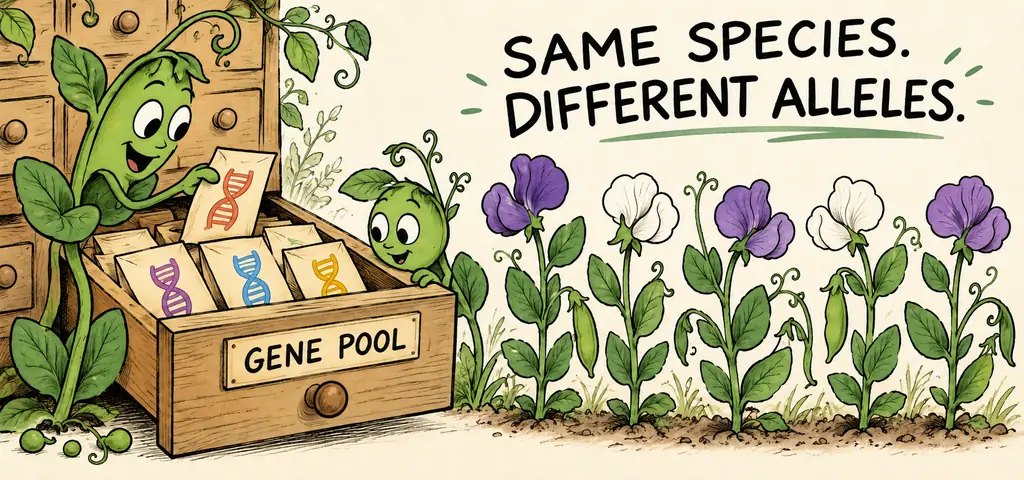
Genetic variation is the presence of heritable differences among individuals in a population. Allelic richness and heterozygosity measure different aspects of that variation. This guide explains how to interpret them when comparing populations and conservation choices.
Imagine two plantings exposed to a fungal pathogen. One is propagated from a single susceptible clone; the other contains several heritable resistance variants. If some of those variants reduce infection, their carriers may leave more surviving offspring in the diverse planting. This is a conditional prediction, not a guarantee that every diverse population survives or every clone dies.
Watch the process
054 Population Variation
Commercial bananas illustrate the risks of shared susceptibility. Cavendish is a group of cultivars, and clonal descendants can acquire mutations, so the label does not mean every plant has an identical genome. Widespread sharing of disease-related genotypes can nevertheless expose many plants to the same pathogen. Measures of genetic variation help you assess that risk.
What Genetic Variation Actually Is, and How It Is Measured
Genetic variation is the presence of different alleles and different genotypes among the individuals of a population. Three useful measures describe different aspects of genetic variation.
Allelic richness is the number of different alleles present at a locus. A population with six alleles at an immune-system locus is richer than one with two, even if the six are unevenly distributed.
Observed heterozygosity is the fraction of individuals heterozygous at a locus, often averaged across loci. It ranges from 0 to 1. Expected heterozygosity is calculated from allele frequencies under a model of random pairing. Allelic richness and heterozygosity can decline at different rates: rare alleles can be lost during a bottleneck before heterozygosity falls greatly.
Nucleotide diversity is the average fraction of nucleotide positions at which two randomly chosen sequences differ, the finest grained of the three and the one sequencing produces directly.
Keep a fourth idea separate from all of them. Phenotypic plasticity is the ability of one genotype to produce different phenotypes in different environments, as when a water plant grows different leaf shapes above and below the surface. It is visible variation that is not genetic variation among individuals: in an experiment using genetically matched clones, differences caused solely by environment are not allele differences, so selection on that difference changes no allele frequency.
Where the Reserve Comes From and Where It Goes
Track how alleles enter a population, how they are combined, and which processes can reduce their diversity. Those processes affect allele counts and heterozygosity in different ways.
On the supply side, mutation can create new alleles. Recombination during meiosis, together with independent assortment and random fertilization, generates new combinations each generation. Gene flow imports alleles from other populations. Balancing selection can preserve two or more alleles rather than letting one win: heterozygote advantage does it in the sickle cell case, and negative frequency-dependent selection does it whenever being rare is an advantage.
Diploidy is a storage mechanism rather than a source. An allele whose harmful effect is fully recessive is not selected against through that effect in a heterozygote, as a Hardy–Weinberg calculation illustrates: when a recessive allele is rare, most of its copies are in heterozygotes rather than in the homozygotes selection can remove. The population is therefore holding alleles that are currently neutral or harmful in particular combinations and may become advantageous if conditions change.
Directional selection can reduce variation at loci under selection. Genetic drift changes allele frequencies by chance and can remove alleles, especially in small populations. Bottlenecks and founder events can sharply reduce diversity through sampling. Inbreeding increases homozygosity without directly changing allele frequencies; it can expose harmful recessive variants and contribute to inbreeding depression.
Measuring the Cost of a Bottleneck
Two populations of the same beetle are surveyed at ten loci. Population G has never been reduced in size. Population H passed through a bottleneck of about 20 individuals forty years ago and now numbers 4000 again.
| Population G | Population H | |
|---|---|---|
| Current census size | 4200 | 4000 |
| Mean number of alleles per locus | 6.8 | 2.1 |
| Observed heterozygosity | 0.62 | 0.19 |
| Loci with only one allele present | 0 | 4 |
What do the numbers show, and what do they predict about each population’s response to a new pathogen?
Step 1: compare what census size says with what the genetic data say. Their present census sizes are similar: 4000 is about 4.8 percent below 4200. If census size were what mattered, they would be equivalent. They are not, which is the point of the comparison.
Step 2: quantify the present difference. H has lower allelic richness than G by \[\frac{6.8-2.1}{6.8} = \frac{4.7}{6.8} = 0.69,\] about 69 percent, and its observed heterozygosity is lower by \[\frac{0.62-0.19}{0.62} = \frac{0.43}{0.62} = 0.69,\] about the same fraction. These are comparisons between populations, not measurements of H’s loss from its own historical baseline. Four sampled loci in H appear fixed, meaning only one allele remains and no variation at those loci is available to selection at all.
Step 3: explain why recovery in numbers did not restore variation. The bottleneck was a sampling event: 20 diploid individuals carried at most 40 allele copies per autosomal locus, and whatever was not in that sample was gone. Population growth afterward copies the alleles that survived; it does not recreate the ones that did not. Restoring variation requires mutation, which is slow, or gene flow from another population.
Step 4: predict. Faced with a new pathogen, population G is potentially more likely to contain useful resistance variants if these markers reflect relevant diversity. Ten unspecified loci do not directly measure fungal resistance, however. Infection assays and resistance-related genotyping are needed. H cannot change allele frequencies by selection alone at a fixed locus, but a fixed allele could already confer resistance.
Answer
Equal census sizes, unequal gene pools. H has about 69 percent lower allelic richness and observed heterozygosity than G at the sampled loci. Its history is consistent with bottleneck loss, but the table lacks a pre-bottleneck baseline and direct pathogen-resistance measurements.
Why Diversity Decides Outcomes
Follow the possible chain from variation to reproductive success. A population holds variation. An environmental change makes some phenotypes better at surviving and reproducing. Heritable variants associated with greater reproductive success may increase in frequency. Persistence also depends on how quickly conditions change, population size, and other ecological constraints; useful variation does not guarantee survival.
Consider crop plantings and fragmented wild populations. Genetically uniform crop plantings can share susceptibility to a pathogen, and the countermeasure is to plant distinct varieties or to breed resistance in from wild relatives. Small, fragmented wild populations lose variation to drift and inbreeding faster than they regain it, which is why conservation programs move individuals between reserves to restore gene flow.
Choosing Between Two Conservation Plans
A bighorn sheep herd of 60 animals has been isolated for thirty years. Lamb survival has declined, and genetic surveys show heterozygosity of 0.11 against 0.44 in the nearest large herd. Managers propose two plans. Plan 1: double the herd’s food supply to raise numbers quickly. Plan 2: translocate eight rams from the large herd every few years. Evaluate both.
Name the hypothesis before choosing a plan. Low heterozygosity and declining lamb survival are consistent with inbreeding depression, but they do not exclude poor nutrition, disease, or habitat effects. Relatedness, health, and offspring survival measurements can help distinguish the causes.
Evaluate Plan 1. Supplemental food may improve survival if nutrition is limiting. More successful breeders may also slow further drift, but feeding does not directly introduce missing alleles. An increase in census size is not necessarily an equal increase in effective population size.
Evaluate Plan 2. If suitable, unrelated migrants breed successfully, translocation can introduce alleles and increase offspring heterozygosity. It could improve survival when inbreeding depression is an important cause. Moving eight rams does not itself guarantee genetic rescue: relatedness, actual mating success, disease risk, and local adaptation need evaluation.
Compare offspring survival, heterozygosity, and reproductive contribution before and after management, with suitable comparison groups. Nutrition and genetic management can address different constraints and need not be mutually exclusive.
Answer
Plan 2 more directly addresses reduced genetic variation, conditional on suitable migrants reproducing. Plan 1 may address nutritional limitation. The observations alone do not prove why lamb survival declined or guarantee either outcome.
Population Size and Genetic Variation
Population size counts organisms; genetic diversity describes variation among them. A population that has recovered in numbers after a bottleneck may still have reduced genetic diversity. A small population newly fragmented from a large one may still be genetically rich for a while. When a stem gives you both numbers, use the quantity relevant to the question; size, genetic variation, and environmental conditions can each matter.
Genetic diversity does not benefit every individual equally. Population genetic diversity describes variation across individuals. A particular organism’s outcome also depends on its own genotype and conditions. A diverse population may survive if some members carry effective resistance, while susceptible members may suffer. Actual outcomes require information about the pathogen, resistance variants, and environment. Saying that a diverse population is more resistant is a shorthand worth avoiding, because the mechanism is that a diverse population is more likely to contain resistant individuals.
Selection requires heritable variation available when it acts; mutation and gene flow can supply new variants after an environmental change begins.
Mutation creates alleles, gene flow can import them, recombination rearranges them, and balancing selection can maintain them. Drift can remove alleles; inbreeding changes their pairing and reduces heterozygosity.
A large census does not guarantee genetic diversity. Populations can adapt through changing frequencies of inherited variants; individuals can acclimate without genetic evolution.
Variation in populations
Practice question 1
Two herds of the same species have identical census sizes, but herd J has a mean of 5.9 alleles per locus and herd K has 1.8. If a novel virus arrives, assume this measured diversity reflects variation at infection-related loci and neither herd already has fixed complete resistance. The better prediction is that
-
both herds respond identically, because population size determines survival
-
herd J is more likely to persist, because it is more likely to contain individuals carrying alleles that limit the infection
-
herd K is more likely to persist, because uniform herds transmit fewer pathogens
-
neither herd can respond, because viral resistance requires new mutations
Practice question 2
A clonally propagated crop shows many leaf sizes across a field solely because of differences in soil moisture; the plants have the same genotype at the relevant loci. This variation
-
is genetic variation and can be acted on by selection
-
is phenotypic plasticity, so selection acting on leaf size would change no allele frequencies
-
demonstrates that mutation rates rise under environmental stress
-
shows that the crop population is at Hardy-Weinberg equilibrium
Practice question 3
Which management action would most directly increase the genetic variation of a small, isolated population?
-
supplemental feeding
-
predator removal
-
introducing unrelated individuals carrying different alleles that then breed successfully
-
restricting breeding to the healthiest adults
Practice answer key
1. B; 2. B; 3. C.
Practice answer explanations
-
Variation in populations, Question 1. Choice B is correct. With equal census sizes, the difference between the herds is the size of the reserve selection can draw on, and the herd holding more alleles per locus is more likely to contain individuals whose alleles limit the infection. Choice A treats census size as the operative variable when the stem holds it constant. Choice C invents a transmission benefit of uniformity that runs against the shared-susceptibility problem. Choice D denies that standing variation can supply resistance, which is precisely what standing variation does.
-
Variation in populations, Question 2. Choice B is correct. The stem specifies genetic identity at the relevant loci, so leaf-size differences produced by soil moisture are phenotypic plasticity, and selection acting on them changes no allele frequency because the plants do not differ genetically. Choice A calls a non-genetic difference genetic. Choice C asserts stress-induced mutation as the cause, which the stem does not support and which would not produce a moisture gradient in leaf size. Choice D applies an equilibrium model to a population that does not reproduce sexually at random.
-
Variation in populations, Question 3. Choice C is correct. The stated migrants carry different alleles and breed successfully, directly adding genetic variation. Moving organisms alone would not guarantee gene flow. Choices A and B raise survival and may slow further loss by increasing numbers, but neither restores lost alleles. Choice D narrows the set of breeders further, which accelerates the loss of variation rather than reversing it.
Continue your review at the AP Biology study hub.

Related to This Article
More math articles
- Free Grade 3 English Worksheets for North Dakota Students
- Virginia SOL Grade 3 Math Worksheets: 49 Free PDFs
- What Skills Do I Need for the ACCUPLACER Math Test?
- Common Core Algebra 1 Free Worksheets: 64 Free Printable PDFs Aligned to CCSS Algebra 1
- How to Find Angles as Fractions of a Circle
- How to Pass the GED Math Test in 30 Days (A Realistic Plan, Not a Cram Session)
- Series Behavior with the n-th Term Test: Divergence Test
- Free Grade 8 English Worksheets for Rhode Island Students
- Pennsylvania PSSA Grade 5 Math Worksheets — 49 Free Printable Single-Skill PDFs
- Compare and Contrast Structure






What people say about "Genetic Variation: How to Understand Population Diversity"?
No one replied yet.