Biodiversity Made Simple: Richness and Evenness
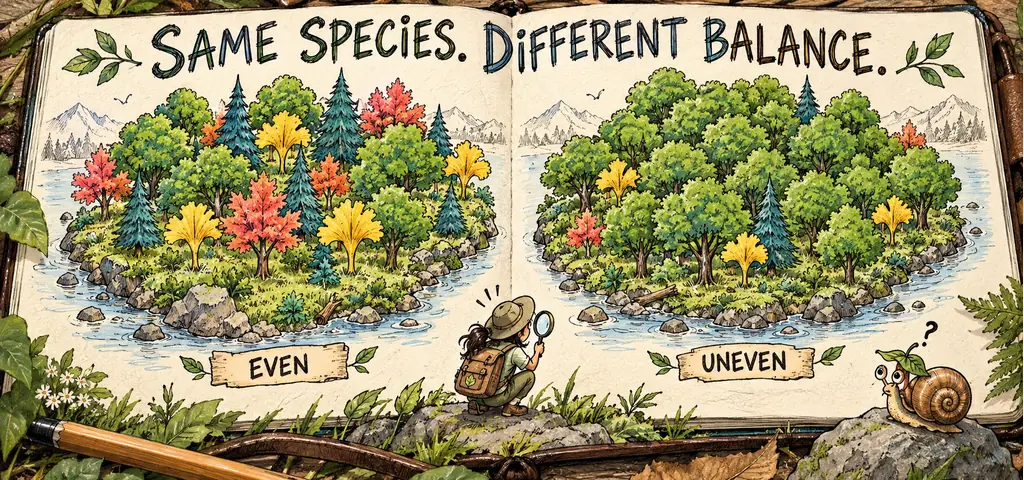
Biodiversity at the community level depends on both species richness and evenness. Richness counts the species present; evenness describes their relative abundances. This guide uses worked examples to show why the two measures can lead to different conclusions.
Two crews each count a hundred trees and find four species. In one plot the counts are 25, 25, 25, and 25. In the other they are 85, 5, 5, and 5. The species totals match, but the abundance patterns differ. A pathogen that kills every tree of the dominant species could remove 85 trees from the second plot and only 25 from the first.
Watch the process
Biodiversity
Species counts omit how individuals are distributed among species. Record the abundances as well: they are needed to compare evenness and to calculate an abundance-based diversity index.
Simpson’s diversity index combines the species present with their relative abundances. The calculation below uses the version supplied on the AP Biology equation sheet.
Counting species is not the same as measuring diversity. Species richness is the number of species present; species evenness describes how individuals are distributed among them. Two communities can have identical richness and behave nothing alike, because one is dominated by a single abundant species while the other divides its individuals among all of them.
Biodiversity can be described at genetic, species, and ecosystem levels. Genetic diversity is variation in alleles within a population, and supplies the heritable differences on which natural selection acts; low relevant genetic variation can limit adaptive response, although an existing genotype may already tolerate a change. Species diversity is richness and evenness within a community, which is what Simpson’s index measures. Ecosystem diversity is the variety of distinct communities and physical settings across a region, which is what a reserve system tries to capture. Losing a species reduces richness by one; the effect on a diversity index also depends on abundance, losing most of a species’ populations can gut its genetic diversity long before the species itself disappears, and the surviving population is then fragile in a way a head count would never reveal.
Species richness and Simpson’s diversity index measure different aspects of a community. Richness is a count of species and nothing more. Diversity combines that count with evenness, meaning how equally the individuals are spread across the species present. Two communities with identical richness can differ enormously in diversity, and a community with fewer species can be more diverse than one with more species if it is much more even. If a choice justifies a diversity answer by citing only the number of species, check the proportions before you accept it.
The AP equation sheet gives Simpson’s diversity index as \[D = 1-\sum \left(\frac{n}{N}\right)^{2},\] where \(n\) is the number of individuals of one species and \(N\) is the total for all species. The symbol \(\sum\) is an instruction, not a quantity: it says to compute \((n/N)^2\) separately for every species present and then add those results together. Four species means four terms to add. Work the rest from the inside out. The ratio \(n/N\) is one species’ share, and squaring it gives the probability that two independent draws with replacement are both that species. Summing the squares gives the probability that two random individuals match, a measure of dominance, and subtracting from 1 flips it into the probability that they are different species. \(D\) runs from 0, one species holding everything, toward 1, many species in equal proportions.
Same Richness, Different Evenness
Two forest plots each contain 100 individuals belonging to 4 tree species. Plot A holds 25, 25, 25, and 25 individuals. Plot B holds 85, 5, 5, and 5. Calculate \(D\) for each plot and interpret the difference.
Plot A. Each species’ share is \(25/100 = 0.25\), and \(0.25^2 = 0.0625\). There are four such terms: \[\sum \left(\frac{n}{N}\right)^{2} = 0.0625 + 0.0625 + 0.0625 + 0.0625 = 0.25,\] \[D = 1-0.25 = 0.75.\]
Plot B. The dominant species has share \(85/100 = 0.85\), and \(0.85^2 = 0.7225\). Each of the three rare species has share \(5/100 = 0.05\), and \(0.05^2 = 0.0025\), so those contribute \(3 \times 0.0025 = 0.0075\). Then \[\sum \left(\frac{n}{N}\right)^{2} = 0.7225 + 0.0075 = 0.73,\] \[D = 1-0.73 = 0.27.\]
Interpretation. Richness is 4 in both plots, so a species count alone would call them equivalent. The index says otherwise. In Plot A two independent draws with replacement select different species 75 percent of the time; in Plot B only 27 percent of the time, because most draws pull the dominant species twice. The entire difference comes from evenness, and it matters ecologically: a pathogen specific to Plot B’s dominant species would remove 85 percent of the trees, while the same event in Plot A would remove 25 percent and leave three co-dominants standing.
Answer
\(D_{A} = 0.75\) and \(D_{B} = 0.27\). Equal richness, unequal evenness, and the more even community has the higher index. Under the stated species-specific pathogen scenario, it also loses a smaller fraction of its trees.
Memory Hook: Simpson’s Index Is a Probability
Every step of \(1-\sum (n/N)^2\) is a probability statement, so you can rebuild the formula without memorizing it. Make two random draws with replacement. For two distinct individuals sampled without replacement, the exact finite-sample expression differs; use the formula supplied on the AP sheet. \((n/N)^2\) is the chance both are species one. Sum over the species and you have the chance they match. Diversity is the chance they do not match, so subtract from one. If your calculated \(D\) comes out negative or above 1, you have made an arithmetic error, because probabilities cannot leave that range.
Can Fewer Species Be More Diverse?
Community P has 3 species among 100 individuals: 34, 33, and 33. Community Q has 5 species among 100 individuals: 92, 2, 2, 2, and 2. Which community has the higher Simpson’s diversity, and what does the comparison teach about richness?
Do P first. The three shares are \(0.34\), \(0.33\), and \(0.33\). Squaring gives \(0.1156\), \(0.1089\), and \(0.1089\). Summing, \[\sum \left(\frac{n}{N}\right)^{2} = 0.1156 + 0.1089 + 0.1089 = 0.3334,\] \[D_{P} = 1-0.3334 = 0.6666 \approx 0.667.\]
Now Q. The dominant share is \(0.92\), and \(0.92^2 = 0.8464\). Each of the four rare species has share \(0.02\), and \(0.02^2 = 0.0004\), so together they contribute \(4 \times 0.0004 = 0.0016\). Summing, \[\sum \left(\frac{n}{N}\right)^{2} = 0.8464 + 0.0016 = 0.848,\] \[D_{Q} = 1-0.848 = 0.152.\]
Read the comparison. Community Q has more species, 5 against 3, and less than a quarter of the diversity, \(0.152\) against \(0.667\). Each rare species makes a small contribution to the sum of squared proportions, so Simpson’s index weights common species strongly. This is a property of the index, not evidence that rare species are ecologically unimportant. A rare keystone species can have a large effect that an abundance-based diversity index does not measure.
Notice how the index responds to structure rather than to inventory. If the dominant species’ count fell by 30 while the combined counts of rare species rose by 30, richness would not change at all and \(D\) would climb steeply. If you added a sixth species with a single individual, richness would rise and \(D\) would barely move.
Answer
\(D_{P} = 0.667\) and \(D_{Q} = 0.152\), so the three-species community is far more diverse. Richness alone cannot rank communities; evenness is doing most of the work in the index.
One caution for exam day. Other sources define Simpson’s index differently. The AP equation sheet uses \(1-\sum (n/N)^2\), so higher means more diverse and a value near zero means one species holds nearly everything.
Why Diversity Buffers Disturbance
A community may contain several species that contribute to the same ecosystem function, and those species differ in what they tolerate, so the odds that at least one survives a disturbance and continues the function are higher. Functional redundancy can support ecological resilience: the capacity to absorb a disturbance and keep functioning, or to recover function afterward. It raises the probability of persisting; it does not make a system indestructible.
The mechanism has a name worth knowing: functional redundancy, meaning that several species in a community perform the same ecological job. If six insect species pollinate a plant and three of them are lost to a cold spring, pollination can continue if the surviving species provide sufficient compatible pollination. If one species pollinates it and that species is lost, pollination stops. Redundancy is why the relationship between diversity and stability is probabilistic rather than guaranteed: adding a seventh pollinator does not make the system safe, it makes failure less likely.
Genetic diversity can provide a similar buffer within a population when individuals differ at relevant resistance or tolerance loci. A field planted with a susceptible clone may suffer widespread damage, while a population containing effective resistance variants may retain reproductive survivors. Neither outcome is guaranteed by a diversity label alone. The outcome depends on the particular resistance variants and environmental conditions.
Diversity also matters because ecosystems do work that people depend on. Ecosystem services are those functions: pollination of crops, water filtration by wetlands, flood buffering by forests and marshes, decomposition and nutrient recycling by soil organisms, carbon storage, and the biological sources of many pharmaceuticals. When a question asks why the loss of an inconspicuous species should concern anyone, a biological explanation can identify a function and the evidence for its contribution. Conservation decisions may also involve cultural and intrinsic values; those are distinct from a testable ecosystem mechanism.
Species diversity combines richness and evenness. Biodiversity also includes genetic and ecosystem diversity. Species with overlapping functions but different tolerances can help maintain a function after disturbance.
With richness fixed, making abundances more even raises this diversity index. Loss of relevant genetic variation can reduce a population’s capacity to respond to a new pressure even while the species count stays the same.
Never rank two communities by species count alone, and never claim diversity guarantees stability. Overlapping functions and different tolerances can improve persistence; assess those properties rather than inferring them from the index alone.
Biodiversity, evenness, and redundancy
Practice question 1
A sample of 40 individuals contains 20 of species 1, 10 of species 2, and 10 of species 3. Simpson’s diversity index for this sample is
-
\(0.375\)
-
\(0.625\)
-
\(0.500\)
-
\(3.00\)
Practice question 2
Community J has 8 species, with 93 percent of individuals belonging to one of them. Community K has 4 species in nearly equal numbers. Which comparison is best supported?
-
J is more diverse, because it contains twice as many species
-
K is more diverse, because its individuals are distributed evenly, and evenness contributes to Simpson’s index along with richness
-
the two are equally diverse, since Simpson’s index depends only on the number of species
-
J is more diverse, because a community with one strongly dominant species is buffered by that species’ abundance
Practice question 3
A wheat field is planted entirely with one genetically uniform variety. The shared genotype is susceptible to a new fungal strain, while a comparison population contains heritable resistance variants. The uniform field is more vulnerable mainly because
-
genetically uniform plants grow more slowly and are therefore weaker
-
the shared susceptible genotype leaves little standing genetic variation for a resistance response
-
uniform fields have lower species richness, which directly lowers Simpson’s index
-
the plants cannot mutate in response to the fungus, because they are all one genotype
Practice answer key
1. B; 2. B; 3. B.
Practice answer explanations
-
Biodiversity, evenness, and redundancy, Question 1. Choice B is correct. The shares are \(20/40 = 0.5\), \(10/40 = 0.25\), and \(10/40 = 0.25\), so \(\sum (n/N)^2 = 0.25 + 0.0625 + 0.0625 = 0.375\) and \(D = 1-0.375 = 0.625\). Choice A reports the sum of squares without subtracting it from 1, which measures dominance rather than diversity. Choice C is the share of the most abundant species. Choice D reports richness, which the index does not equal.
-
Biodiversity, evenness, and redundancy, Question 2. Choice B is correct. Simpson’s index combines richness with evenness, and a community in which one species holds 93 percent of individuals has a large squared share, a large sum, and therefore a small \(D\), even with eight species present. Choice A ranks the communities by species count alone, which is the misconception the index exists to correct. Choice C denies the evenness term outright. Choice D confuses dominance with diversity: a species holding 93 percent of the individuals makes the sum of squared shares large and therefore makes \(D\) small, and it also concentrates the community’s risk in one species rather than spreading it.
-
Biodiversity, evenness, and redundancy, Question 3. Choice B is correct. The stem specifies a shared susceptible genotype and resistance variants in the comparison population. This gives the variable population standing heritable variation on which selection can act, while the uniform planting lacks it. A invents a necessary growth penalty. C confuses genetic variation within a species with species richness. D wrongly makes a uniform genotype incapable of mutation; mutation remains possible but is not directed by need.
Continue your review at the AP Biology study hub.

Related to This Article
More math articles
- How Sudoku Helps Improve Logical Thinking and Mathematical Reasoning
- 3rd Grade ACT Aspire Math FREE Sample Practice Questions
- The Ultimate GRE Math Course: The Only Course You Need for Success
- Laptop Buying Guide: Essential Tips to Know Before You Buy
- Word Problems of Comparing and Ordering Rational Numbers
- 4th Grade English Worksheets for North Carolina (EOG): 57 Free Printable PDFs
- Visualizing the Magic: How to Multiply Fractions Using Models
- SSAT Lower Level Math Practice Test Questions
- High School Placement Test (HSPT): Complete Guide
- How to Create a GED Math Study Plan?






What people say about "Biodiversity Made Simple: Richness and Evenness"?
No one replied yet.