Population Regulation: How to Understand Density
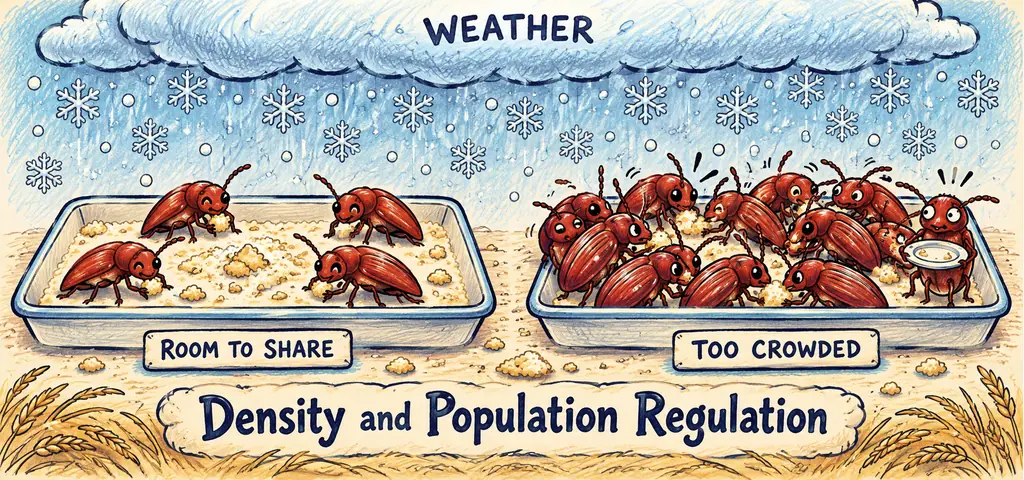
Population regulation describes the feedback that can limit population growth. Density-dependent effects change with crowding; density-independent effects do not systematically strengthen with crowding. Compare the effect per individual to distinguish them.
Consider two events in the same beetle population. In July, crowding leaves late-hatching larvae with little food, and mortality among them approaches 70 percent. In October, an early freeze kills roughly 80 percent of the survivors. Both events reduce numbers. To distinguish them, ask whether reducing the initial density would reduce each individual’s risk.
Watch the process
Population Ecology: The Texas Mosquito Mystery – Crash Course Ecology #2
Compare the per-capita effect, meaning the effect per individual, across densities. If crowding changes that effect, the factor is density-dependent. An effect that stays the same per individual across densities is density-independent.
A density-dependent factor is one whose per-capita effect varies with density. In the standard limiting-factor model, harm increases as density rises, creating negative feedback. At very low density, difficulty finding mates can instead lower per-capita growth; this is an Allee effect. The July starvation qualifies, because crowding is what made food scarce. So do competition for nest sites, territories, and light; predation, when predators concentrate on whatever prey has become abundant and easy to find; accumulation of metabolic waste in a closed or slow-flushing environment; and contagious disease, which spreads faster when hosts contact one another more often. Stress responses belong here too: crowded rodents show elevated stress hormones, delayed sexual maturation, and higher rates of abandoning young, and each of those lowers the per-capita birth rate as density rises.
A density-independent factor is one whose per-capita effect is essentially unrelated to how crowded the population is. The October freeze qualifies. Floods, fires, hurricanes, droughts, ash falls, and habitat destruction are common examples when their proportional effects do not depend on density. Their names alone do not establish the response; crowding can modify damage in some settings. A freeze severe enough to kill 80 percent of a population kills about 80 percent whether that population numbers 200 or 20,000, in this hypothetical density-independent comparison.
Why the Distinction Decides the Shape of the Curve
Only density-dependent factors can regulate a population, in the technical sense of holding it near a value. The reason is feedback. When density rises, a density-dependent factor pushes birth rates down or death rates up, which lowers density, which relaxes the factor. That is negative feedback, and negative feedback is what produces the S-shaped logistic curve and gives the phrase “carrying capacity” any meaning at all. Density-independent factors have no such loop. A hurricane does not become more likely because there are more birds, and it does not ease off once the population thins. It knocks the population down from wherever it happened to be, and recovery depends on survival, resources, and subsequent conditions.
Read that difference off a graph. In a simple negative-feedback model, a regulated population can fluctuate within a band, dropping when it climbs above a level and recovering when it falls below. A population held mainly by density-independent events crashes at irregular intervals with no consistent ceiling and may sit for years far below what the resources could support.
Both kinds of factor can affect one population. A weather event that reduces numbers is not automatically density-dependent. Classify it using the relationship between crowding and per-capita risk.
Sort the Data, Then Name the Mechanism
An ecologist tracks a bird population in six separate woodlots that differ in density, and records for each the percentage of nests losing all chicks. The results are: 5 pairs per hectare, 12 percent nest failure; 10 pairs, 15 percent; 20 pairs, 28 percent; 30 pairs, 41 percent; 45 pairs, 62 percent; 60 pairs, 71 percent. In a separate year, a late snowstorm hits all six woodlots and destroys between 54 and 59 percent of nests in every one. Classify each source of mortality.
Take the first data set. Nest failure rises from 12 percent to 71 percent as density rises twelvefold, and the increase is monotonic across all six woodlots. The per-capita effect, which is exactly what a percentage is, grows with density. That is consistent with density-dependent nest failure, although other woodlot differences could explain the association.
Take the storm. The failure rate is between 54 and 59 percent in every woodlot, and the woodlots span densities from 5 to 60 pairs per hectare. The per-capita effect is flat with respect to density, so the storm is density-independent. Note that the storm killed more nests in absolute terms in the dense woodlots, because there were more nests there to kill. Absolute numbers rising with density do not establish density dependence; percentages rising with density is the evidence.
Answer
The first data set supports density dependence; possible mechanisms include competition for food or nest sites, or predators concentrating where nests are dense. The snowstorm is density-independent. The diagnostic is whether the per-capita rate, not the raw count, changes with density.
The Inference Trap in Field Data
Separate the observed association from its possible causes. The bird data above show a correlation: denser woodlots had higher nest failure. A correlation in field data is not, by itself, evidence that density caused the failure. The dense woodlots might also be the older ones, or the wetter ones, or the ones nearest a road, and any of those could drive nest failure while merely happening to coincide with density. Field data collected across sites that differ in many ways at once cannot separate those explanations.
What would separate them is manipulation. Take woodlots that are similar in age, moisture, and surroundings, and randomly assign controlled breeding densities where feasible, maintaining comparable resource availability and handling controls, then measure failure. Simply changing nest-box numbers may also change nest-site availability, so that manipulation needs appropriate controls. If failure still tracks density when everything else was held constant, density is doing the work. State what the design supports and which alternatives remain. When you see a correlation drawn from observation, ask what else varies along that same axis. When you see a manipulation with controls, you are allowed to talk about cause.
A Density Manipulation in Flour Beetles
A researcher sets up 24 identical containers of flour, each with the same temperature, humidity, and food volume. Containers are randomly assigned to starting densities: eight receive 10 adults, eight receive 50, and eight receive 200. Adult age and sex ratios are matched. After 40 days the researcher counts surviving offspring per adult: 8.4 at 10 adults, 5.1 at 50, and 1.2 at 200. Evaluate what this supports.
Claim. Surviving offspring per founding adult decline with starting density under the tested conditions.
Evidence. Offspring produced per adult, a per-capita measure, falls sevenfold as starting density rises twentyfold. Food volume, temperature, and humidity were identical across all containers, and eight replicates per treatment guard against a single odd container driving the result.
Reasoning. Because density was the only variable the researcher set, and everything else was held constant by design, the design supports a causal density effect more strongly than the woodlot comparison. Replicate variability should still be examined; the means alone do not quantify uncertainty. This is the comparison the woodlot field data could not make. What the experiment does not identify is which density-dependent factor operates: competition for food, waste accumulation, egg cannibalism, and interference between adults are all consistent with it, and separating them would take further manipulation.
Interpreting the result
The data support a density effect on net offspring output, which combines reproduction and offspring survival, because a controlled change in density alone changed per-capita output. They do not identify the mechanism, and a choice naming a specific mechanism as proven would go beyond the evidence.
In the standard regulation model, density-dependent negative feedback lowers per-capita growth as crowding increases. Density-independent events lack that feedback, though they can change resources and carrying capacity.
If crowding increases per-capita mortality or reduces per-capita reproduction under the stated conditions, it supplies density-dependent negative feedback. A density-independent factor does not systematically strengthen with crowding.
A larger population can lose more individuals even when each individual faces the same risk. Compare per-capita rates before classifying the effect. And when the rate comes from unmanipulated field sites, remember that correlation with density is not the same as regulation by density.
Density-dependent and density-independent regulation
Practice question 1
A wildfire burns through a valley and kills approximately the same percentage of a plant species in a sparse stand and in a dense stand. The fire is best classified as
-
density-dependent, because more individual plants died in the dense stand
-
density-independent, because the per-capita mortality did not depend on crowding
-
a component of carrying capacity, because it reduced the population
-
a form of competition, because surviving plants now have more space
Practice question 2
Which observation is the strongest evidence that a factor is density-dependent?
-
the total number of deaths increases as the population increases
-
the population declines sharply in years with unusually cold winters
-
the percentage of individuals dying increases as individuals per hectare increases
-
the population grows faster in a large habitat patch than in a small one
Practice question 3
Researchers observe across 12 ponds that tadpole survival is lower where tadpole density is higher. Which statement about this result is most defensible?
-
density directly causes the lower survival, since the relationship is consistent
-
the correlation is consistent with density dependence, but pond-to-pond differences could also explain it, so a controlled density manipulation is needed
-
the result shows a density-independent factor because no manipulation was performed
-
the low survival must be what raised the density, since the two vary together and either could be the cause
Practice answer key
1. B; 2. C; 3. B.
Practice answer explanations
-
Density-dependent and density-independent regulation, Question 1. Choice B is correct. The fire kills the same percentage in sparse and dense stands, so its per-capita effect does not depend on crowding, which is the definition of density-independent. Choice A mistakes a larger absolute body count, which follows automatically from having more plants, for a larger per-capita effect. Choice C treats a single event as the ongoing resource limit that sets \(K\). Choice D relabels the aftermath of the fire as the fire itself.
-
Density-dependent and density-independent regulation, Question 2. Choice C is correct. A rising percentage of individuals dying as density rises is a rising per-capita effect, which is exactly what density dependence means. Choice A describes total deaths, which can increase simply because more individuals are exposed, even when the per-capita risk is unchanged. Choice B describes a weather effect, the standard density-independent case. Choice D compares patches by area rather than by density, and a large patch can hold more individuals at the same crowding, so it says nothing about how the per-capita rate responds to density.
-
Density-dependent and density-independent regulation, Question 3. Choice B is correct. The ponds were surveyed, not manipulated, so other pond differences could covary with density, and the correlation supports the hypothesis without isolating density as the cause. Choice A treats consistency across sites as proof of causation. Choice C confuses the absence of a manipulation with evidence for a different category of factor. Choice D reverses the proposed direction of causation and then asserts it, which the correlation supports no better than the forward direction; recognizing that both directions remain open is what makes Choice B the defensible statement.
Continue your review at the AP Biology study hub.

Related to This Article
More math articles
- 5th Grade FSA Math FREE Sample Practice Questions
- Judicial restraint
- 8th Grade ACT Aspire Math Worksheets: FREE & Printable
- CLEP U.S. History I 014: Dutch New Netherland and Plural Middle Colonies
- What is the Best Scientific Calculator for College Students?
- Grade 2 Math Practice for Delaware Second Graders
- How to Do Division Using Partial Quotients
- Structure of the federal judiciary
- Free Grade 3 English Worksheets for Indiana Students
- What is the Side Splitter Theorem? A Complete Introduction and Exploration









What people say about "Population Regulation: How to Understand Density"?
No one replied yet.