Modes of Selection: Compare Patterns and Mate Choice
Directional selection favors one extreme, stabilizing selection favors intermediates, and disruptive selection favors both extremes. Identify which organisms leave more offspring, then use changes in the trait distribution as supporting evidence. Sexual selection concerns differences in mating success.
Measure beak depth in a finch population and plot the values. Most birds may cluster near the middle, with a few at either extreme. Now consider a drought that leaves mainly large, hard seeds for two years. If birds with deeper beaks leave more offspring and the trait is heritable, the distribution can shift in later generations. Modes of selection describe the reproductive advantage across that distribution.
Watch the process
Evolution Continues
Take a trait that varies continuously across a population, such as body mass or beak depth, and plot how many individuals fall at each value. Selection changes relative reproductive success across that distribution. Compare which trait values are favored, then examine changes in the mean and spread.
Before the three names, fix the vocabulary the graphs use. The mean is the average value of the trait, the center of the heap. The variance is how spread out the values are, so a wide flat histogram has high variance and a narrow tall one has low variance. Data tables usually report the standard deviation instead, which is the square root of the variance and therefore the spread written in the trait’s own units, so a standard deviation of \(2.4\ \text{mm}\) describes a typical departure of about 2.4 mm from the mean. Variance and standard deviation both describe spread, but they use different units and have different percentage changes. Either one falling means the measured distribution narrowed. A quantitative trait is one that is measured numerically, often with contributions from many genes and the environment. It may be continuous, such as mass, or a count, such as seed number. Continuous examples can be approximated by smooth distributions. Every mode below is a statement about what happened to the mean and what happened to the variance.
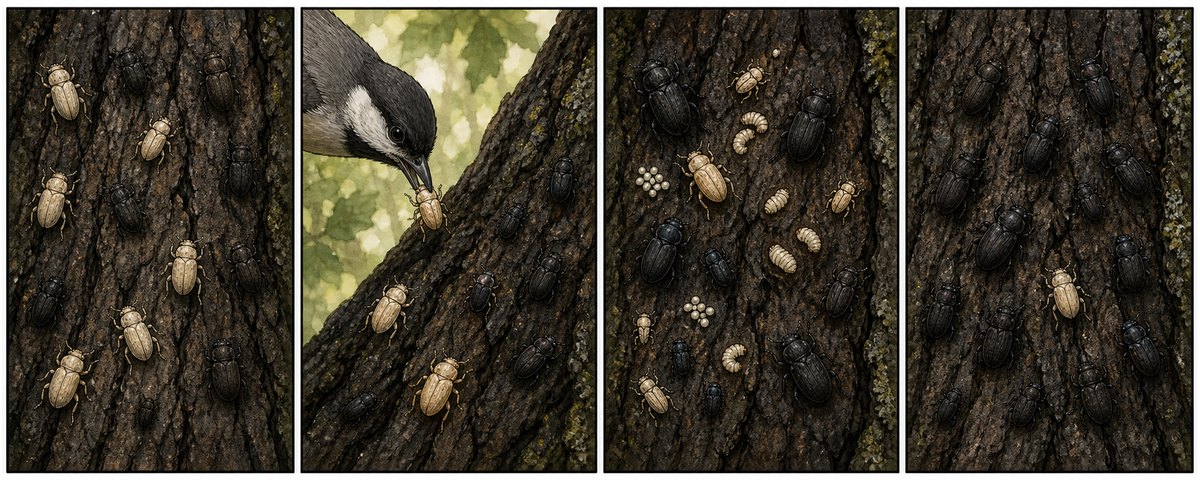
Directional selection favors one extreme, so the mean shifts toward it while the variance can increase, decrease, or remain similar depending on the genetic and environmental context. Peppered moths on soot-darkened bark, finches whose average beak depth rose after a drought left only large seeds, and bacteria under antibiotic pressure are the standard cases. A moving mean is consistent with directional selection, but environmental effects and sampling must also be considered; fitness differences provide the mechanism.
Stabilizing selection favors intermediate values and removes both extremes, so the mean stays put and the variance falls. Human birth mass is the standard case: very small newborns historically faced higher mortality and very large ones caused delivery complications, and the two pressures held the distribution near an intermediate value. Clutch size behaves the same way. Stabilizing selection can help maintain a trait in a stable environment, so stasis does not establish that selection has stopped.
Disruptive selection favors both extremes and removes intermediates, so the mean may not move while the variance rises and the distribution can become bimodal, meaning it shows two separate peaks with a dip between them rather than one central hump. A finch population on an island offering only very small and very large seeds is the textbook case: birds at each extreme exploit one resource efficiently and intermediates handle both poorly. It matters beyond the graph, because a bimodal distribution plus a tendency to mate with similar individuals is one route by which a population begins to split in two.
Two Modes the Graphs Do Not Show
Two further patterns appear in stems even though they are not read off a histogram shape. Frequency-dependent selection means the fitness of a phenotype depends on how common it is. Negative frequency dependence favors whichever variant is rare: a predator that forms a search image for the common prey color leaves the rare color alone, so the rare color does well until it becomes common and loses its advantage. This can maintain a mixture of variants. Positive frequency dependence instead favors a common variant and can reduce variation.
Balancing selection is the general name for any pattern that maintains two or more alleles instead of driving one to fixation, meaning a frequency of \(1.0\) at which it is the only allele left at that locus, and heterozygote advantage, where the heterozygote out-reproduces both homozygotes, is one example. Where falciparum malaria is common, \(HbA/HbA\) individuals are vulnerable to malaria and \(HbS/HbS\) individuals have sickle cell disease, while \(HbA/HbS\) heterozygotes resist malaria without severe disease. Selection removes copies of both alleles from homozygotes each generation while the heterozygote keeps both in circulation, so \(HbS\) settles at a frequency far higher than a purely harmful allele could sustain. Move the population somewhere without malaria and the balance disappears, because the advantage was a property of an environment containing a parasite.
Interpret each fitness value in the environment where it was measured.
Memory Hook: Watch the Mean and the Spread
Three modes describe relative fitness: directional favors one extreme, stabilizing favors intermediates, and disruptive favors both extremes. In simplified graphs these often shift the mean, narrow the spread, or create two peaks, respectively. A disruptive pattern need not leave the mean unchanged. Check fitness evidence before attributing a distribution change to selection.
Sexual Selection Buys Matings with Survival
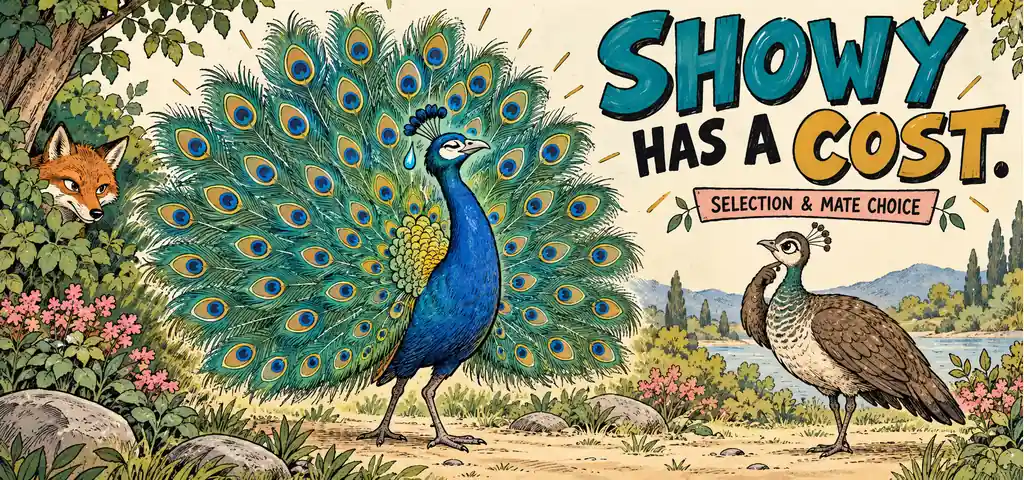
Sexual selection arises from differences in access to mates rather than in survival. Intrasexual selection is competition among members of one sex, typically combat or territory defense among males, and it favors weapons and size. Intersexual selection is choice by the other sex, typically female choice, and it favors ornaments and displays.
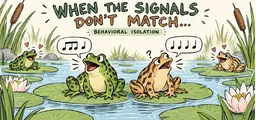
Sexual selection can create trade-offs, because it can favor traits despite a survival cost. A peacock’s train is expensive and conspicuous to predators; a frog calling loudly enough to attract a mate also attracts a bat. These traits persist because fitness is counted in offspring, not in years lived, so a male that lives twice as long but mates half as often has not won. Sexual selection also explains sexual dimorphism: where one sex competes intensely for mates and the other invests more per offspring, the competing sex tends to be the larger or showier one.
Putting Numbers on a Mode of Selection
In a simplified study of a heritable shell-length trait, a biologist compares adult limpets across generations exposed to heavy wave action. Marked individuals of intermediate length leave more surviving offspring than either extreme, and common-environment rearing supports an inherited component. Samples of 400 adults yield the following.
| Before | After | |
|---|---|---|
| Mean shell length (mm) | 24.0 | 24.2 |
| Standard deviation (mm) | 6.0 | 2.4 |
| Percent below 16 mm | 9 | \(<1\) |
| Percent above 32 mm | 9 | \(<1\) |
Identify the mode of selection and support the identification with the numbers.
Work the mean first. It moved from 24.0 to 24.2, a change of \(0.2\ \text{mm}\) against a starting spread of \(6.0\ \text{mm}\). That is a small shift relative to the starting spread. In this simplified example the mean is approximately stable; a formal claim of no change would require uncertainty estimates and an appropriate comparison.
Now work the spread. The standard deviation fell from 6.0 to 2.4, which is a drop of \[\frac{6.0-2.4}{6.0} = \frac{3.6}{6.0} = 0.60,\] a 60 percent reduction in standard deviation. Variance falls from 36.0 to 5.76 square millimeters, an 84 percent reduction. Do not report the standard-deviation percentage as the variance percentage. The tail percentages agree: each tail fell from 9 percent to under 1 percent, so both extremes became less common; the reproductive measurements identify differential success as the mechanism.
A stationary mean with sharply reduced variance and both tails trimmed is stabilizing selection. Check the alternative before committing. The documented advantage belongs to intermediates, rather than to one extreme. Disruptive selection would raise the variance and hollow out the middle, which is the opposite of what the standard deviation reports.
Answer
Stabilizing selection is supported by the measured reproductive advantage of intermediates. The nearly stable mean, 60 percent drop in standard deviation, and reduced tails are consistent with that mechanism; the summary statistics alone do not establish it.
Reading a Selection Graph
Snail shell diameters are distributed around a mean of \(18\ \text{mm}\). A crab predator arrives that can crush shells up to \(20\ \text{mm}\). Twelve generations later the mean is \(24\ \text{mm}\) and the distribution is narrower. Name the mode of selection and justify it, then predict the distribution if a bird that takes the smallest snails also arrived while the crab remained.
Work the two numbers. The mean moved from 18 to 24 and the spread narrowed, and a mean that moves toward one extreme with the opposite tail trimmed is directional selection. The mechanism is in the stem: shells above the crushing limit survive, their bearers reproduce, and large-shell alleles rise.
In the second scenario, the bird removes the smallest snails while the crab still crushes every shell up to its 20 mm limit, so both predators press on the same small tail. That is directional selection pushed harder, not disruptive selection. Disruptive selection requires the intermediate class alone to be disfavored, as it would be if the bird took only mid-sized snails while the smallest hid in crevices.
Answer
The change is directional selection: the mean shifted toward the surviving extreme and the vulnerable tail was removed. Disruptive selection requires the intermediate phenotype to be the disfavored one.
Read Reproductive Success Across a Distribution
Disruptive selection requires that the intermediate phenotype be the one at a disadvantage. If the smallest and the middle are both being eaten while the largest escapes, that is strong directional selection, not disruptive selection, because the middle is not the class singled out.
An unchanged mean does not show that selection is absent. A trait that has not changed for a million years looks, on a graph, like a trait nothing is acting on. Stasis can result from stabilizing selection in a relatively stable environment, and the way to detect it is to look at what happens to variants when they appear. If offspring far from the mean die more often than offspring near it, selection is operating hard, but the flat line alone does not demonstrate the cause.
Selection involves differences in reproductive success across a trait distribution. Its mode is named for which trait values are favored.
Directional favors one extreme; stabilizing favors intermediates; disruptive favors both extremes. Their typical graphs show a shifted mean, a narrowed spread, or two peaks.
Use relative reproductive success to identify the mode, then connect it to the observed mean and spread. The distribution alone does not prove selection.
Modes of selection
Practice question 1
Over twenty generations the mean of a quantitative trait is unchanged while its variance falls sharply. Measurements show intermediates consistently leave more offspring than either extreme. This is
-
directional selection
-
stabilizing selection
-
disruptive selection
-
genetic drift
Practice question 2
Male widowbirds with lengthened tails attract more mates but suffer higher predation. The persistence of long tails is best explained by
-
long tails improving survival in ways not yet measured
-
mating advantage outweighing the survival cost in net reproductive output
-
the tail being an acquired trait not subject to selection
-
genetic drift acting on a large population
Practice question 3
An island offers only very small and very large seeds, and over time the finch population holds many small-billed and large-billed birds and few intermediates. Birds with intermediate bills leave fewer offspring than birds at either extreme. This outcome is
-
stabilizing selection, because the mean bill size did not change
-
directional selection, because the mean bill size increased
-
disruptive selection, because intermediate phenotypes were at a disadvantage
-
gene flow, because two bill types migrated in
Practice answer key
1. B; 2. B; 3. C.
Practice answer explanations
-
Modes of selection, Question 1. Choice B is correct. The measured reproductive advantage of intermediates identifies stabilizing selection. The narrower distribution is consistent with that mechanism. Directional selection favors one extreme (A), while disruptive selection favors both extremes (C). Drift is chance sampling and does not explain the stated consistent fitness differences (D). A change in variance without fitness evidence would support a weaker inference.
-
Modes of selection, Question 2. Choice B is correct. Sexual selection favors traits that increase mating success even at a survival cost, because fitness is counted in offspring rather than in years lived. Choice A invents an unmeasured survival benefit the data contradict. Choice C denies the heritability the scenario depends on. Choice D misapplies drift, which is a random process and would not consistently maintain an elaborate ornament.
-
Modes of selection, Question 3. Choice C is correct. The stem specifies that intermediate bills leave fewer offspring than either extreme, identifying disruptive selection. A would require an intermediate advantage. B would require one extreme to be favored over the other. D proposes immigration without evidence. The reproductive measurements establish the mechanism more directly than the distribution shape alone.
Continue your review at the AP Biology study hub.
For background on these selection patterns and mate choice, see OpenStax Biology 2e: Adaptive Evolution.

Related to This Article
More math articles
- Motor Voter Act
- 49 Free MTYA Grade 5 Math Worksheets for Maine Students (Aligned, One Skill Per Page)
- Free Grade 6 English Worksheets for Illinois Students
- Mean, Median, Mode, and Range: A Plain-English Statistics Guide for 2026
- CPA AUD: Audit Risk vs Materiality in a Planning Scenario (2027 Prep)
- How to Find the Probability of Compound Event?
- Deviance, Crime, and Social Control
- The Ultimate SSAT Upper Level Math Formula Cheat Sheet
- Order of Operations Calculator (PEMDAS) with Steps
- The Best Grade 8 ELA Practice Tests for Indiana Students



What people say about "Modes of Selection: Compare Patterns and Mate Choice"?
No one replied yet.