The Sunbelt, Internal Migration, and Long-Term Demographic Change
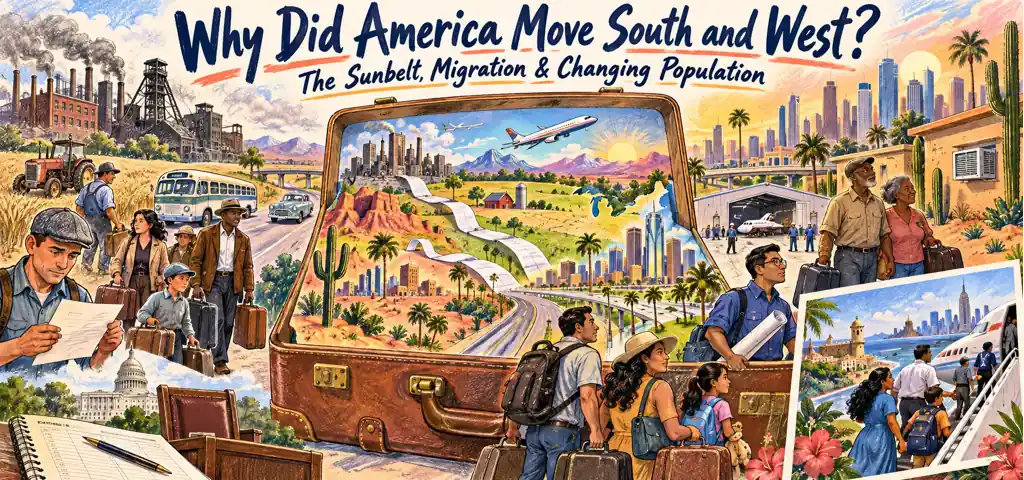
Chapter 12 of the CLEP History of the United States II study guide on Effortless Math covers The Sunbelt, Internal Migration, and Long-Term Demographic Change: the key terms, the core ideas, and worked examples showing how this topic is tested on the exam.
CLEP History of the United States II, Chapter 12
Urbanization crossed a statistical threshold before the Sunbelt boom
The 1920 census was the first to count a majority of Americans in urban places, then defined as incorporated communities of at least 2,500 people. That category included small towns as well as great cities, so the result did not mean that most people lived in New York or Chicago. It did show that industrial employment, transportation networks, and migration had shifted the national balance away from farms. Later suburban and Sunbelt growth changed the location of urban America rather than beginning urbanization from nothing.
Immigration restriction changed the population before later reopening
The National Origins Act of 1924 based its two-percent quotas on the foreign-born population recorded in 1890, favoring northern and western Europe while sharply restricting later source regions. Depression and war further reduced arrivals, and the foreign-born share reached a low point around 1970. The Displaced Persons Act of 1948 admitted refugees but initially charged many admissions against future national quotas. After the 1965 immigration law ended the national-origins system, the foreign-born share rose and Asian and Latin American communities grew rapidly.
The low-income New South is the baseline for measuring convergence
At the start of the twentieth century the South remained disproportionately rural, agricultural, and poor. Sharecropping, tenant farming, low-wage textile work, weak schools, racial exclusion, and limited industrial capital held regional income far below the national average. The gap narrowed only slowly before 1930. A comparison that begins after the Second World War hides the depth and duration of this New South baseline and makes later convergence look automatic rather than historically produced.
War spending accelerated southern income convergence after 1940
Military bases, shipyards, aircraft plants, and federal contracts sent wages and capital into the South and Southwest during the Second World War. Afterward, Cold War defense and aerospace spending continued in places such as Texas, Florida, and southern California. The regional income gap closed much faster after 1940 than before it. Federal purchasing did not erase segregation or poverty, but it created urban jobs, infrastructure, and business networks that weakened the older dependence on low-productivity agriculture.
Farm mechanization pushed people toward urban work
Tractors, chemical weed control, mechanical cotton pickers, hybrid seed, and fertilizer allowed fewer workers to cultivate more land. Federal acreage-reduction payments often went to landowners, who could reduce tenant acreage and labor. Sharecropping nearly disappeared, and the national farm population collapsed after 1940 even as output rose. Wartime factories pulled rural workers toward cities at the same moment that machines reduced the jobs available on farms. Push and pull therefore reinforced each other.
The Sunbelt combined federal spending with climate and business policy
Defense contracts, bases, cheap land, expanding highways, low taxes, and weak unions attracted employers and households to the South and West. Mechanical air conditioning made year-round office, factory, hospital, and residential life more practical in Houston, Phoenix, Atlanta, and other hot metropolitan areas. Portable pensions and Social Security income also allowed retirees to move to Florida and Arizona. The Sunbelt was not one climate zone or one cause; it was a political-economic region assembled through several reinforcing advantages.
Appalachian out-migration followed job loss rather than coal exhaustion
Continuous miners and surface equipment sharply reduced coal employment after the late 1940s even where output continued. Families left central Appalachian counties for Cincinnati, Dayton, Detroit, Chicago, and other industrial cities. A table showing mining jobs falling before or alongside population supports mechanization as the causal link. It does not support the claim that the coal had disappeared. Internal migration often records a change in labor demand more clearly than a change in natural resources.
Segregation limited mobility within northern cities
European immigrant enclaves often changed as residents with higher incomes moved elsewhere and later arrivals replaced them. Black urban neighborhoods operated under stronger external constraints. Mortgage discrimination, restrictive sales practices, violence, and unequal municipal boundaries could keep prosperous and educated Black families from leaving. The result was not cultural unwillingness to move. It was a housing market in which income and education did not purchase the same residential options across racial lines.
Puerto Rican movement was migration by citizens
The Jones Act of 1917 granted United States citizenship by statute to Puerto Ricans, so postwar travel from the island to New York required no immigration visa. Operation Bootstrap drew capital into manufacturing while agricultural employment declined, and inexpensive air travel made movement easier. Several hundred thousand Puerto Ricans relocated to the mainland between 1945 and 1960. Their experience shows why legal citizenship, labor-market change, and transportation must be separated when explaining population movement.
Cuban migration remade South Florida in distinct waves
After the 1959 revolution, many early Cuban arrivals were professionals, property owners, and business families who settled in South Florida. Later federally organized flights carried hundreds of thousands more. Miami developed Spanish-language businesses, media, political organizations, and neighborhoods sustained by the new population. Treating every wave as socially identical erases changes in class, race, timing, and federal reception policy, even though the shared exile story became politically powerful.
Cold War refugee admissions used several legal mechanisms
The 1948 displaced-person program borrowed against future quotas. After the Hungarian uprising of 1956, the Eisenhower administration used remaining refugee visas and then stretched the parole authority in the 1952 immigration law to admit many more. After 1975, Vietnamese, Lao, and Cambodian refugees passed through reception centers and were deliberately dispersed among sponsors nationwide. Secondary migration soon created communities in Orange County, Saint Paul, the Central Valley, Long Beach, and other places. Admission rule and final settlement pattern were not the same.
Population growth shifted national political weight
Repeated census reapportionment moved House seats and electoral votes from the Northeast and Midwest toward the South and West. By 1980 the South and West together held more people than the older industrial regions. That transfer did not require northern population to vanish; faster growth elsewhere was enough. Demographic change affects public power through district boundaries, representation, federal formulas, and the location of campaign competition. A regional population table therefore has institutional as well as social meaning.
Industrial-city fiscal crises exposed linked losses
New York City's 1975 crisis followed years in which manufacturing jobs and middle-income residents moved to suburbs and the Sunbelt while service obligations and borrowing remained. A shrinking tax base did not alone dictate insolvency, and spending choices still mattered. Yet population, employment, and municipal finance cannot be analyzed separately. When jobs and taxable income leave one jurisdiction while infrastructure and poverty costs remain, regional growth can create metropolitan fiscal strain far from the destination cities.
Disaster can change a city's population unevenly
Hurricane Katrina in 2005 displaced residents from New Orleans, and the city's 2010 population remained well below its 2000 count. Black and poor residents faced especially severe barriers to return because housing, employment, insurance, transport, and public services recovered unevenly. A disaster does not move a representative sample of a population. Return depends on resources and policy, so aggregate population loss can conceal a change in the social composition of the city.
Long-term demographic change includes aging and renewed diversity
After 1970 the foreign-born share rose, Hispanic Americans became the largest minority population, Asian American communities expanded, and the baby-boom cohort aged. Sunbelt metropolitan growth continued while some older industrial centers lost people or grew slowly. These trends did not move in one direction everywhere. National averages combine immigration, births, deaths, internal movement, and changing legal categories. Historical interpretation begins by identifying which component actually changed.
connect a regional income series to mechanisms
A table shows the South's income gap narrowing modestly before 1930 and rapidly after 1940.
Migration evidence should distinguish permission, pressure, and destination
A citizenship rule can permit movement, a lost farm or mine job can push it, and an expanding factory or service sector can attract it. Sponsorship policy may select an initial destination without determining where families later cluster. A strong demographic explanation identifies the legal channel, economic push and pull, transport network, and household resources instead of treating movement as a single undifferentiated choice.
Watch the history in motion
This short lesson adds voices, images, and chronology to the ideas you just studied.
Video: How Migration & Immigration Changed the United States [APUSH Review], Heimler's History.
Try four CLEP-style questions
- Puerto Ricans had held statutory United States citizenship since 1917, but mainland migration accelerated after 1945 as island farm employment fell and air travel became cheaper. Which inference best explains the timing?
- Falling farm employment probably reduced migration by leaving fewer households able to finance travel.
- Cheaper flights adequately explain the increase without considering island or mainland labor demand.
- Legal permission was longstanding; changing jobs and transportation help explain the later surge.
- Citizenship affected timing chiefly through a delayed generational response to the 1917 statute.
- Island evidence by itself identifies expanding New York employment as the principal attraction.
- A series reports southern income relative to the national average from 1900 through 1960. What is the chief advantage of including observations well before 1940?
- They compare defense-contract growth in southern states with awards to other regions.
- They reveal whether Black and white workers received equal wages within each southern industry.
- They separate changes in farm output from changes in the number of agricultural workers.
- They compare slow prewar narrowing from a low base with faster postwar convergence.
- They isolate population growth in air-conditioned cities from growth in cities without it.
- A historian argues that manufacturing losses and suburban out-migration alone caused a city's fiscal crisis. Which finding would most weaken that monocausal claim?
- The city lost factory jobs while several suburbs gained office and retail employment.
- Some former residents continued to commute into the city after moving away.
- Federal highway funds made suburban commuting easier during the same decades.
- The city's aging infrastructure required continued maintenance after population declined.
- Comparable cities lost similar tax capacity but followed different borrowing and spending paths.
- A Sunbelt state's population grows rapidly between two censuses. Which evidence is needed to determine how much of the increase came from domestic migration rather than immigration or natural increase?
- The state's new House-seat allocation compared with its previous delegation
- The percentage of residents living in incorporated urban places above 2,500
- The number of retirees receiving portable pensions or Social Security income
- The value of federal defense contracts awarded to firms located in the state
- Births minus deaths, foreign arrivals, and state-to-state moves measured separately
Check your answers and reasoning
Independent preparation. CLEP is a registered trademark of the College Board, which does not endorse this lesson.

Related to This Article
More math articles
- Top Proven Strategies To Increase Your SAT Math Score
- Your Coach’s Playbook: How to Understand Percent of Change
- 10 Most Common HSPT Math Questions
- Kansas KAP Grade 6 Math Free Worksheets: 72 Free Printable Worksheets with Step-by-Step Keys
- 10 Most Common 6th Grade MAP Math Questions
- Free TExES Art EC-12 (178) Practice Test
- Complete Guide to Biconditionals: Definitions and Usage
- How to Plan and Save for College? (+FREE Worksheet!)
- Algebra 1 EOC Formula Sheet: What Is Given and What You Still Need to Know
- How to Complete the Table of Division Two-Digit Numbers By One-digit Numbers





















What people say about "The Sunbelt and Postwar Internal Migration"?
No one replied yet.