GED Science Practice: How to Read Experiments, Graphs, and Evidence
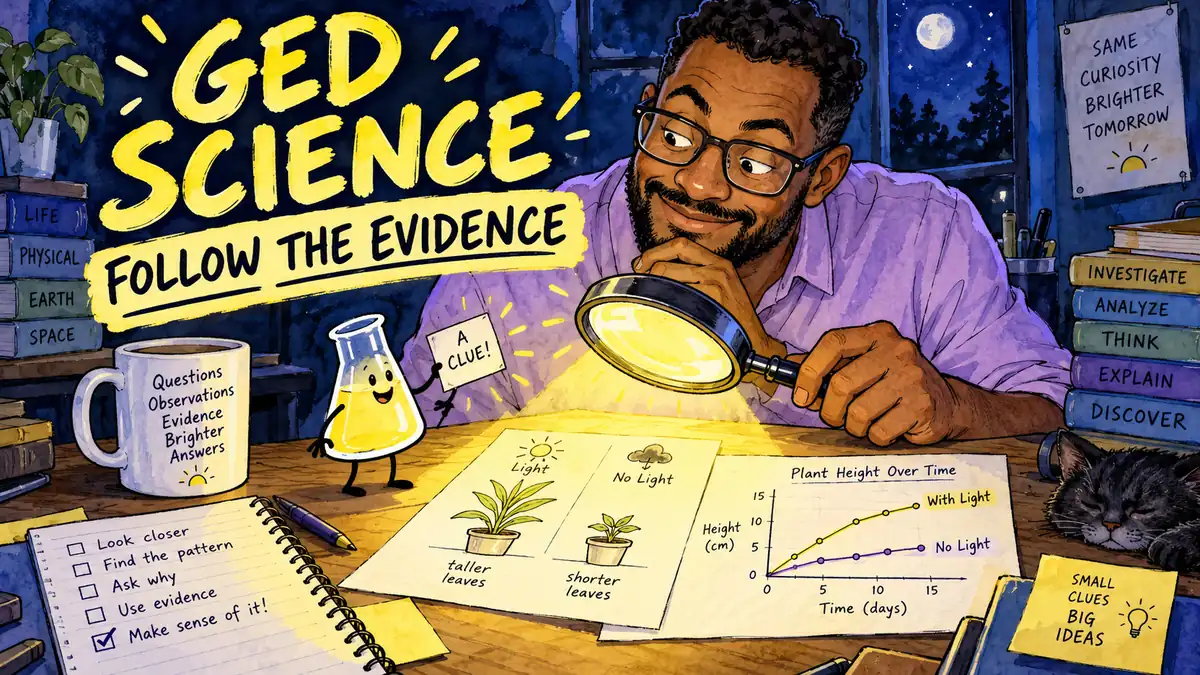
An unfamiliar organism in a GED Science practice question can slow you down before you even reach the task. Start with the setup. What changed, and what did the researcher measure?
For GED Science practice, identify the variables, read graph labels and numerical scales, and choose a conclusion the evidence supports. Review the science concepts behind the question too. Our video and the original examples below let you rehearse those tasks.
Watch this lesson on YouTube · English captions available.
Prepare for the reasoning GED Science asks you to do
GED Science allows 90 minutes with no break. The test includes reading scientific information, interpreting experiments, and working with quantities and graphics. See the official GED subject overview for timing and question formats.
The official GED Science page emphasizes scientific concepts, measurement, experimental setup, and data interpretation. Review life science, physical science, and Earth and space science alongside those reasoning skills.
Put the term to work. For “dependent variable,” practice locating the measured result in an experiment. Calculate a mean from three measurements.
Use three questions to understand an experiment
Before evaluating a conclusion, identify the independent variable, the dependent variable, and the conditions kept constant.
| Ask yourself | Look for |
|---|---|
| What did the researcher deliberately change? | The independent variable. |
| What outcome did the researcher measure? | The dependent variable. |
| What conditions stayed the same? | Controlled variables that make the comparison fairer. |
A control group is a comparison group. A controlled variable is a condition held constant. Those two terms describe different parts of an investigation.
Worked example: light and seedlings
In this original teaching example, a student grows the same type of seedling in identical pots. One group receives four hours of light each day. The other gets eight. Both groups receive the same soil, water, and temperature. After two weeks, the student measures each seedling’s height.
Name both variables before opening the answer.
Show the explanation
The independent variable is daily light duration. The dependent variable is seedling height after two weeks. Plant type, soil, water, temperature, and growing time are controlled conditions.
If the eight-hour group is taller on average, the results support a statement about these seedlings under these conditions. The experiment does not establish that every plant grows taller with more light.
How many plants were tested? With several seedlings per group, you can inspect the spread of heights and see whether one unusually tall plant accounts for the difference in averages. One plant per group leaves that uncertainty unresolved.
Try changing the question. If the student measured leaf count instead of height, leaf count would become the dependent variable. Daily light duration would still be the independent variable. Follow what this experiment actually measured.
Read the graph’s numbers before judging its shape
A steep-looking line can show a small numerical change. Read the title, axis labels, units, and scale before describing a trend. Check whether an axis begins at zero or starts near the measured values.
Suppose a graph shows a measurement increasing from 48 to 50 units, with the vertical axis running from 47 to 51. The change occupies much of the graph, but the actual increase is 2 units. Relative to the starting value, that is 2 ÷ 48 × 100, or about 4.17%.
That is a small numerical increase on a tightly cropped scale. The values remain 48 and 50. Calculate from the values.
Try a calculation from a data set
Three trials record 12, 15, and 18 seconds. What is the mean time?
Show the solution
Add the times and divide by the number of trials: (12 + 15 + 18) ÷ 3 = 45 ÷ 3 = 15 seconds. Include the unit. If the question asks for the range instead, subtract the smallest value from the largest: 18 − 12 = 6 seconds.
Choose a conclusion the evidence can support
Read each answer as a claim. Locate the observation that would justify it. Be careful with claims about all organisms, all conditions, or a cause that the experiment did not isolate.
Suppose a survey finds that students who report more sleep also report higher grades. The survey shows an association in that group. It does not isolate sleep as the cause of the grade difference. Study time, health, and other factors might also matter.
Separate the observation from its explanation. “The solution changed color” describes an observation. A proposed reason for that change needs supporting evidence.
Use missed questions to choose your next science lesson
After a practice set, sort your uncertain answers by cause. You might need to review a concept, read a scale more carefully, identify a variable, or limit an inference. Choose one cause for your next session.
For a graph-reading session, take a few unfamiliar graphs and describe their units and numerical trends. Label variables in several fresh investigations. Then try a timed mixed set.
Build a longer practice routine with the book
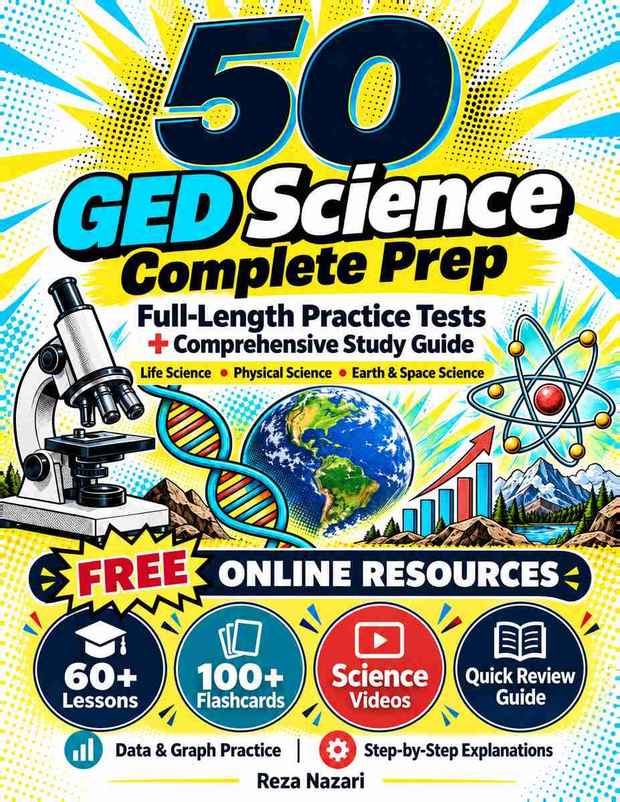
Our GED Science Complete Prep by Reza Nazari combines science review, worked questions, chapter practice, and answer explanations with 50 distinct full-length practice tests. Ten tests are in the book/PDF and 40 additional tests are online. Each practice form has 34 questions.
The ten book tests also have matching online companions. These repeat the same forms, so the collection contains 50 distinct tests total. Use the explanations to revisit your reasoning before attempting a fresh form.
Questions about GED Science preparation
Do I need to memorize every science fact?
Build familiarity with the main concepts and practice applying information supplied in questions. Graph interpretation and experimental reasoning deserve regular attention. GED’s official Science page explains that needed formula information is supplied.
How do I know if I am ready?
Independent practice helps you identify strengths and gaps. Check official GED readiness resources before scheduling. A book percentage does not convert to an official GED score.
You can also strengthen the calculations behind data questions through our GED Math Online Center. For your next science session, explain what one experiment changed, measured, and held constant.
These examples were created for this article. Effortless Math’s article and book are independent resources, not affiliated with or endorsed by GED Testing Service. Practice results do not guarantee passing.

Related to This Article
More math articles
- The Fourteen Points, Versailles, and the League Fight
- How to Graph Quadratic Inequalities? (+FREE Worksheet!)
- Understanding Decimals for 5th Grade: Place Value and Meaning
- The Best Grade 3 Math Book for Pennsylvania Students
- Distinguishing Angles: Acute, Right, Obtuse, and Straight
- A Comprehensive Guide to the SfAT Test in 2026
- Judicial activism
- North Carolina EOG Grade 7 Math Worksheets: 95 Free Printable Skill PDFs with Keys
- Words for Actions, Movement, and Change
- Confrontation of witnesses












What people say about "GED Science Practice: Experiments, Graphs & Evidence"?
No one replied yet.