Read axes before curves
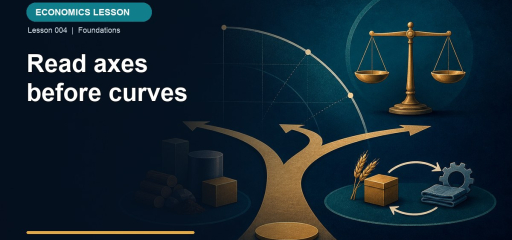
Read axes before curves: this Effortless Math guide explains the topic in plain language, shows how it works through solved examples, and gives you free practice to try immediately, so the idea sticks instead of staying abstract.
A graph is a relationship between labeled variables.
Start with the vertical axis, horizontal axis, and units. A demand curve usually places price vertically and quantity horizontally, but a production graph may place output vertically and labor horizontally. The same visual slope can mean something different when the variables change. Never identify a curve from shape alone.
Imagine opening a graph and seeing two downward-sloping lines. One could be a demand curve relating a product’s price to the quantity buyers plan to purchase. The other could be a marginal-product curve relating the number of workers to the extra output produced by the next worker. Their shapes look similar, but they answer different questions because their axes and units differ. The first may be measured in dollars per item and items per week. The second may be measured in units of output per worker. Before interpreting a point, say the axis labels aloud and attach the units. This ten-second habit prevents many avoidable errors.
Slope is vertical change divided by horizontal change. A negative slope means the variables move in opposite directions. A positive slope means they move together. Economic interpretation requires more. The downward slope of demand describes the quantity response to the good’s own price, holding demand determinants constant. It does not say that income or tastes fell.
To calculate slope between two points, use slope=(change in the vertical variable)/(change in the horizontal variable) =(y2-y1)/(x2-x1). The order must be consistent: if the numerator uses final minus initial, the denominator must do the same. Suppose a demand curve contains the points (Q=20,P=12) and (Q=30,P=9). With price on the vertical axis, its slope is (9-12)/(30-20)=-3/10=-0.3 dollar per additional unit. Reversing both subtractions gives the same result. Reversing only one produces the wrong sign.
Slope and elasticity are not interchangeable. Slope measures a change in the units printed on the axes. Elasticity measures percentage responsiveness and has no unit. Changing the measurement of quantity from individual bottles to cases changes the numerical slope of a demand curve but does not change the underlying elasticity at a point. This is why the exam may show a steep-looking curve without giving enough information to classify elasticity from appearance alone.
A movement along a curve occurs when an axis variable changes. A shift occurs when the relationship changes at every relevant axis value. If the price of coffee rises, quantity demanded of coffee moves along demand. If the price of tea, a substitute, rises, coffee demand shifts. Draw arrows only after deciding which kind of change occurred.
When several curves appear, build a benchmark before following the story. Locate the original intersection or choice, mark its price and quantity, and then change only the curve justified by the event. A change in an input price belongs on supply because it changes sellers’ costs at each possible output price. A change in consumer income belongs on demand, although the direction depends on whether the good is normal or inferior. The event determines the curve. The new intersection determines the outcome.
| What changes? | What happens on the graph? | Question to ask first |
|---|---|---|
| An axis variable | Movement to another point on the same curve | Which quantity responds to the variable on the other axis? |
| A non-axis determinant | The entire curve shifts | At the old axis value, would more or less be chosen? |
| Units of measurement | The numerical scale or slope may change | Has the economic relationship changed, or only its label? |
| Technology or resources | A production or cost relationship may shift | What can be produced from each given input level? |
Read the labels before the shape
A graph places hours of labor on the horizontal axis and total output on the vertical axis. Output rises from 90 to 108 when labor rises from five to six hours. The slope over that interval is 18 units of output per labor-hour. Calling the slope “$18” would invent a money unit that is not on the graph. Calling the change “demand” would identify the curve from its shape instead of its variables.
On an economics exam item, use a four-pass reading. First name both variables and units. Second locate the original point. Third decide whether the event changes an axis variable or a determinant held outside the graph. Finally describe the result in a complete sentence: not merely “right,” but “demand shifts right, raising equilibrium price and quantity.” That sentence supplies a built-in check against an arrow drawn on the wrong curve.
Watch the idea in action
A focused video lesson from Linda Stone.

Reza is an experienced Math instructor and a test-prep expert who has been tutoring students since 2008. He has helped many students raise their standardized test scores--and attend the colleges of their dreams. He works with students individually and in group settings, he tutors both live and online Math courses and the Math portion of standardized tests. He provides an individualized custom learning plan and the personalized attention that makes a difference in how students view math.
Related to This Article
More math articles
- How to Graph Transformation on the Coordinate Plane: Rotation?
- Reading and Interpreting Line Plots for 4th Grade
- The Ultimate 7th Grade OSTP Math Course (+FREE Worksheets)
- Full-Length ATI TEAS 7 Math Practice Test-Answers and Explanations
- Turn a graph into an AP free-response answer
- 5 Best Reliable Calculators for School, Home, and Work
- How to Solve Work-Rate Word Problems: Step-by-Step Guide for 2026
- The Best Grade 5 Math Book for Virginia Students
- The Ultimate ASVAB Math Formula Cheat Sheet
- Full-Length ASVAB Math Practice Test-Answers and Explanations





















What people say about "Read the Axes Before the Curves"?
No one replied yet.