Cellular Respiration: Stages and 30–32 ATP Yield
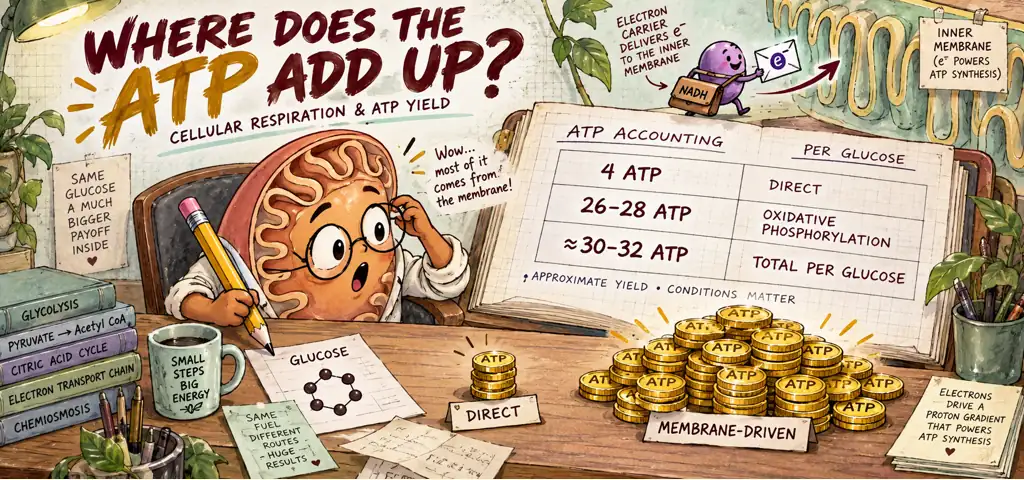
Cellular respiration yields about 30–32 ATP per glucose in the simplified aerobic eukaryotic model used here. Four ATP equivalents come directly from glycolysis and the Krebs cycle; the remaining 26–28 come from oxidative phosphorylation. The total depends on the accounting assumptions and is not a fixed yield for every cell.
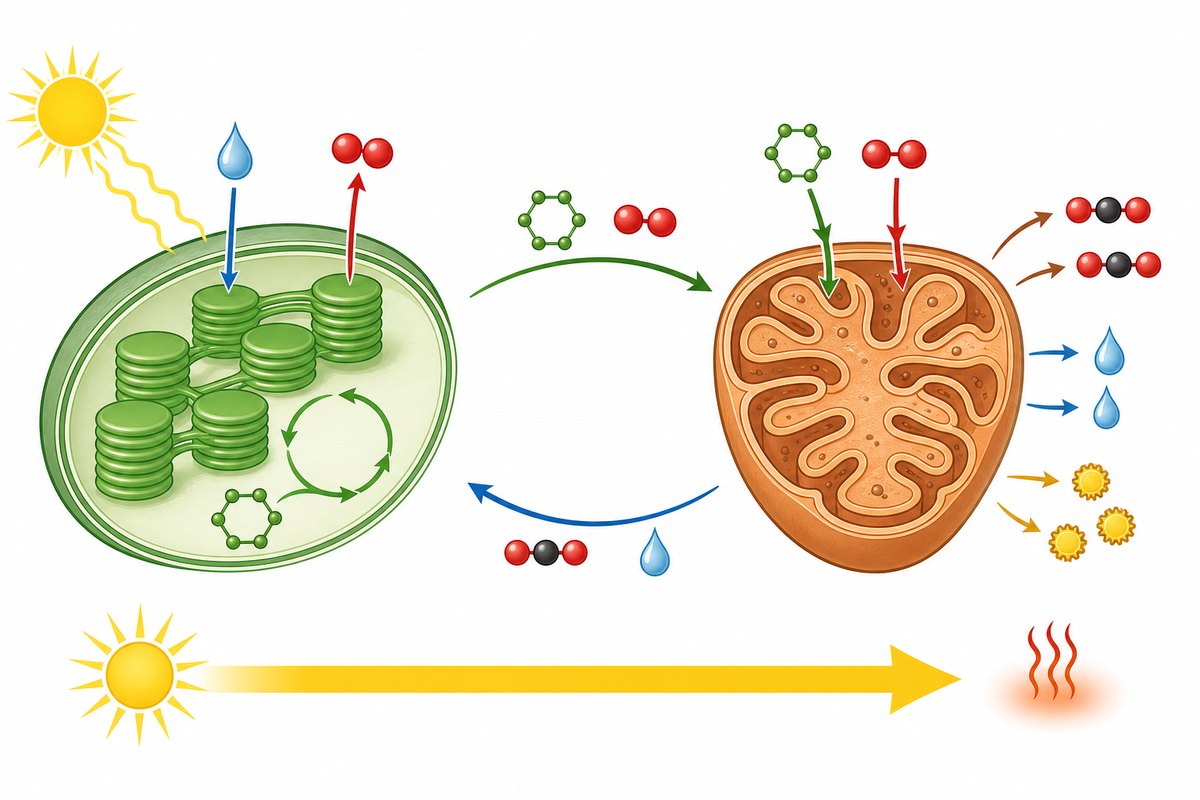
Both a flame and aerobic cellular respiration oxidize carbon-containing fuels, producing carbon dioxide and water. Their reaction mechanisms differ. Respiration proceeds through enzyme-controlled steps that couple part of the overall free-energy release to ATP production. A flame releases energy mainly as heat and light; harnessing its heat for work requires an appropriate temperature difference and a machine.
Watch the process
Cellular Respiration (UPDATED)
For each stage, record where the carbon goes, which electron carriers are reduced, and how much ATP is produced directly. Keeping separate accounts helps you avoid assigning the ATP made later at the membrane to an earlier stage.
Cellular respiration is the controlled, stepwise oxidation of glucose that moves part of its stored free energy into ATP. In one line, \[\text{C}_6\text{H}_{12}\text{O}_6 + 6\,\text{O}_2 \longrightarrow 6\,\text{CO}_2 + 6\,\text{H}_2\text{O} + \text{energy} .\] That arrow hides four stages. For the same overall reactants, products and conditions, the overall free-energy change does not depend on the route. Cells use enzyme-controlled reactions to couple part of that energy release to ATP synthesis. Track three things separately through the pathway to keep the accounts separate: where the carbon goes, where the electrons go, and where the ATP is made.
Stage 1: Glycolysis, in the Cytosol
Glycolysis splits one six-carbon glucose into two three-carbon pyruvate molecules. It happens in the cytosol, needs no oxygen, and occurs in essentially every living cell, which marks it as ancient. The first phase invests 2 ATP to phosphorylate and destabilize the sugar; the second harvests 4 ATP by substrate-level phosphorylation, a direct phosphate transfer from a metabolic intermediate to ADP. Net per glucose: 2 ATP, 2 NADH, 2 pyruvate, and no carbon dioxide at all, so all six carbons remain in the two pyruvates.
That two-phase structure repays a closer look, because the first phase looks like a mistake until you see what it buys. Glucose is uncharged but polar, and it can leave through an appropriate transporter if its gradient favors exit. Attaching a phosphate at the cost of one ATP makes it charged, so it is trapped inside, and raises its free energy, so the later cleavage becomes favorable. A second ATP is spent to add a second phosphate. Only then does the six-carbon sugar split into two three-carbon fragments, and each of those fragments is then oxidized by \(\text{NAD}^+\) and stripped of phosphates to make ADP into ATP. Four ATP come back for the two invested. The pattern is general: catabolic pathways often spend energy up front to destabilize a stable molecule, and you should not read that investment as a loss.
Two details help keep the glycolysis account accurate. First, since the harvest phase runs twice, once per three-carbon fragment, every number in it doubles per glucose, and the totals must therefore include both fragments. Second, glycolysis is regulated at phosphofructokinase, the enzyme catalyzing the first committed step of the investment phase. ATP can inhibit phosphofructokinase allosterically, while AMP and, in some systems, ADP signal low energy availability and favor activity. Regulation depends on the enzyme form and cellular conditions. That is feedback inhibition, applied here to the pathway a cell can least afford to run wastefully.
Glycolysis also tells you something about evolutionary history. It needs no oxygen, no membrane, and no organelle, and it is widely distributed across organisms, with many conserved features as well as variant pathways and exceptions. Its broad distribution and conserved features support an early evolutionary origin, while variant pathways and exceptions limit claims of universality.
Stage 2: Pyruvate Oxidation, in the Matrix
Each pyruvate enters the mitochondrial matrix, where one carbon leaves as \(\text{CO}_2\), the two-carbon remainder is oxidized, and the acetyl group is attached to coenzyme A to form acetyl CoA. Per glucose this happens twice: 2 \(\text{CO}_2\), 2 NADH, 0 ATP. Prokaryotes run this stage and the next in the cytosol and their transport chain in the plasma membrane.
Stage 3: The Krebs Cycle, in the Matrix
The Krebs cycle, also called the citric acid cycle, joins each acetyl group to a four-carbon acceptor and oxidizes the resulting citrate through steps that release two \(\text{CO}_2\), regenerate the acceptor, and load carriers. Per turn: 3 NADH, 1 \(\text{FADH}_2\), 1 ATP equivalent (ATP or GTP, depending on the enzyme form), 2 \(\text{CO}_2\); two turns per glucose, so double it. The net carbon balance accounts for six carbon dioxides per fully oxidized glucose, although the newly entering acetyl carbons are not necessarily the ones released on those first turns, and almost none of the energy has appeared as ATP yet. It is sitting in reduced carriers. Most cycle enzymes are in the matrix; succinate dehydrogenase is embedded in the inner mitochondrial membrane.
Stage 4: Electron Transport and Chemiosmosis
The electron transport chain is a series of protein complexes embedded in the inner mitochondrial membrane. NADH and \(\text{FADH}_2\) deliver electrons to it, and those electrons pass from carrier to carrier along an overall favorable sequence of redox transfers, with a net favorable transfer toward oxygen; an individual local step need not be downhill. Oxygen is the final electron acceptor, picking up electrons and protons to form water. Without oxygen to accept them, electrons back up, the carriers stay reduced, and the whole chain stops.
In the mitochondrial chain, complexes I, III and IV use electron-transfer energy to move protons from the matrix into the intermembrane space; complex II does not pump protons. Together these transfers build a proton gradient of both concentration and charge across a membrane nearly impermeable to hydrogen ions. Protons flow back through ATP synthase, which turns the flow into rotation and the rotation into ATP. That coupling is chemiosmosis; driven by electrons from food it is oxidative phosphorylation. NADH enters the chain earlier than \(\text{FADH}_2\) and drives more pumping, which is why the two are worth different amounts of ATP.
An ATP Ledger for One Glucose
| Stage | Net direct ATP equivalents | NADH | FADH2 |
|---|---|---|---|
| Glycolysis | 2 | 2 | 0 |
| Pyruvate oxidation | 0 | 2 | 0 |
| Two cycle turns | 2 | 6 | 2 |
| Total | 4 | 10 | 2 |
For the middle stages, review pyruvate oxidation and Krebs cycle products. For membrane coupling, continue with electron transport and chemiosmosis.
Using the supplied approximate accounting of 2.5 ATP per NADH and 1.5 ATP per \(\text{FADH}_2\), total the ATP yield from the complete aerobic oxidation of one glucose molecule, and explain why the textbook range is 30 to 32 rather than a single number.
Count the direct ATP. Glycolysis nets 2 ATP. The Krebs cycle makes 1 ATP or GTP per turn and turns twice, so 2 ATP equivalents. Direct total: 4 ATP equivalents by substrate-level phosphorylation.
Count the carriers. Glycolysis: 2 NADH. Pyruvate oxidation: 2 NADH. Krebs: 6 NADH and 2 \(\text{FADH}_2\). Totals are 10 NADH and 2 \(\text{FADH}_2\).
Convert and add. \[10\ \text{NADH} \times 2.5 = 25, \qquad 2\ \text{FADH}_2 \times 1.5 = 3, \qquad 25 + 3 + 4 = 32\ \text{ATP} .\]
Now defend the range. The 2 NADH from glycolysis are made in the cytosol, and NADH cannot cross the inner mitochondrial membrane. Their electrons are carried in by a shuttle. The malate-aspartate shuttle delivers them to NADH inside the matrix and preserves the full 2.5 ATP each. The glycerol phosphate shuttle delivers them to FAD instead, so each is worth 1.5. Using the second shuttle costs \(2 \times 1.0 = 2\) ATP, giving 30. These are model estimates, not fixed yields for every cell or organism. Two further reasons the number is approximate: the proton gradient also powers transport work such as importing phosphate and pyruvate, and the membrane leaks protons, so not every pumped proton returns through ATP synthase. Older books report 36 to 38 because they assumed 3 ATP per NADH and 2 per \(\text{FADH}_2\).
ATP total under these assumptions
32 ATP with the malate-aspartate shuttle and 30 with the glycerol phosphate shuttle; 26 to 28 of that total comes from chemiosmosis, not from substrate-level phosphorylation.
Most ATP production therefore depends on the membrane gradient. Four ATP out of about 30 are made directly; everything else depends on an intact membrane holding a gradient. An uncoupler increases proton leak and reduces the gradient available for ATP synthesis. Oxidative ATP production falls; electron transport and oxygen consumption can increase when oxygen and respiratory substrates are available. Substrate-level ATP production is a separate process, so uncoupling does not imply that all cellular ATP production instantly becomes zero.
Measuring Respiration with a Respirometer
Germinating peas, dry dormant peas, and glass beads of equal volume are each sealed in a respirometer containing potassium hydroxide, which absorbs carbon dioxide as fast as it is produced. Each respirometer is submerged and the movement of water into its pipette is read every five minutes. After 20 minutes the readings are: germinating peas, 0.44 mL; dormant peas, 0.06 mL; beads, 0.02 mL.
Claim. Germinating seeds respire at roughly ten times the rate of dormant seeds once the bead control is subtracted, and the apparatus measures oxygen consumption specifically.
Evidence. Correct each reading for the physical control and convert to a rate. \[\text{germinating: } \frac{0.44-0.02}{20} = 0.021\ \text{mL/min}, \qquad \text{dormant: } \frac{0.06-0.02}{20} = 0.002\ \text{mL/min}.\] The ratio is \(0.021 / 0.002 = 10.5\). That is the ratio of these two corrected average volume rates, not evidence that every germinating seed respires exactly 10.5 times faster. Replicates would help estimate uncertainty; comparison per seed mass would require mass measurements.
Reasoning. Oxygen is consumed while carbon dioxide is produced. Without a carbon-dioxide absorber, their effects on gas volume partly offset; how much they offset depends on the respiratory quotient, the ratio of carbon dioxide released to oxygen consumed. The potassium hydroxide removes the carbon dioxide as it forms, so a corrected decrease in gas volume can estimate oxygen uptake if the system is sealed, carbon dioxide absorption is effective, and temperature and pressure effects are controlled. The bead-only vessel provides a physical control for background movement. A matched control helps correct physical effects; it does not itself keep temperature or pressure constant.
Interpretation. Germination switches on the metabolic machinery needed to build a seedling: high demand for ATP, high rate of aerobic respiration, high oxygen consumption. In these example readings, dormant seeds have a lower corrected volume rate; they are still alive and respiring. Without potassium hydroxide, the reading would reflect the balance of oxygen uptake and carbon dioxide release. It would approach zero when the two gas amounts are similar, rather than under every possible fuel or condition.
What the respirometer data support
Under the sealed-system, gas-absorption and physical-control assumptions, these example readings estimate average oxygen uptake of 0.021 mL/min for germinating peas and 0.002 mL/min for dormant peas over 20 minutes. Their ratio is 10.5; a general biological conclusion needs replicated, appropriately normalized measurements.
Distinctions to keep clear
Glycolysis has a different relationship to oxygen from the respiratory electron transport chain. Glycolysis is not by itself an electron-transport-based anaerobic respiratory pathway. Fermentation is often used to name the whole ATP-producing process including glycolysis; distinguish that usage from the NADH-reoxidation reactions that follow glycolysis. It is a cytosolic pathway that runs whether or not oxygen is present, and it needs no oxygen directly at any step. Glycolysis does require a continuing supply of NAD+. In aerobic eukaryotic cells, shuttle pathways transfer cytosolic NADH electrons into mitochondrial respiration. Fermentation can regenerate cytosolic NAD+ without oxygen, allowing glycolysis to continue; the respiratory chain is not the only route to carrier recycling.
Most ATP in aerobic respiration comes from oxidative phosphorylation. Glycolysis and the Krebs cycle make ATP directly, but their combined direct yield is a small part of the aerobic total. They produce four of about thirty. Their real output is reduced carriers, and the carriers are cashed in later at the membrane. When a stem asks what a stage produces, answer with the carriers first.
Review: Cellular Respiration and the ATP Ledger
Respiration releases the free energy of glucose down a staircase of small steps so that part of each drop can be captured, rather than all at once as heat.
The net carbon dioxide release comes from pyruvate oxidation and the cycle. Oxidized carriers NAD+ and FAD accept electrons and become reduced carriers; NADH and enzyme-bound FADH2 then transfer those electrons toward the respiratory chain. ATP equivalents are made directly in glycolysis and the cycle and indirectly through oxidative phosphorylation.
Watch the doubling. Each glucose produces two pyruvates and two acetyl-CoA entries into the cycle. Double the per-pyruvate and per-cycle-turn totals when counting per glucose; do not describe the entire electron transport chain as simply happening twice.
Respiration stages and ATP accounting
Practice question 1
A researcher supplies cells with glucose labeled at every carbon position and collects the \(\text{CO}_2\) released. The labeled carbon first appears in \(\text{CO}_2\) produced during
-
glycolysis
-
pyruvate oxidation
-
the Krebs cycle
-
the electron transport chain
Practice question 2
A drug makes the inner mitochondrial membrane freely permeable to protons. The most immediate consequence is that
-
electron transport halts because oxygen can no longer accept electrons
-
the proton gradient collapses, so ATP synthase loses its driving force while electron transport continues
-
glycolysis stops because ATP is no longer available to phosphorylate glucose
-
the Krebs cycle accelerates because more \(\text{NAD}^+\) is available
Practice question 3
In aerobic respiration, most of the ATP produced per glucose comes from
-
substrate-level phosphorylation during glycolysis
-
substrate-level phosphorylation during the Krebs cycle
-
direct transfer of phosphate from \(\text{FADH}_2\) to ADP
-
chemiosmosis driven by electrons carried from NADH and \(\text{FADH}_2\)
Practice answer key
1. B; 2. B; 3. D.
Practice answer explanations
-
Respiration stages and ATP accounting, Question 1. Choice B is correct. No carbon dioxide is released during glycolysis, so the earliest a label can appear in \(\text{CO}_2\) is the decarboxylation of pyruvate in the matrix. Choice A names the one stage of respiration that releases no carbon dioxide at all. Choice C releases carbon dioxide later in the pathway. Because all glucose carbons are labeled, label can already appear during pyruvate oxidation; a single-position label would require its specific carbon position to be known. Choice D handles electrons and protons and produces water rather than carbon dioxide.
-
Respiration stages and ATP accounting, Question 2. Choice B is correct. A proton leak destroys the gradient that ATP synthase depends on, so oxidative ATP synthesis falls while electron transport can continue and may accelerate if oxygen and respiratory substrates remain available. Choice A reverses the causation, since oxygen is unaffected. Choice C jumps several steps downstream and ignores that glycolysis needs very little ATP to start. Choice D describes a secondary effect on the Krebs cycle rather than the immediate one.
-
Respiration stages and ATP accounting, Question 3. Choice D is correct. Only about 4 ATP per glucose come from substrate-level phosphorylation; the remaining 26 to 28 come from chemiosmosis powered by electrons delivered by NADH and \(\text{FADH}_2\). Choices A and B each name one of those 4 direct ATP. Choice C invents a direct phosphate transfer from \(\text{FADH}_2\), which never occurs.
Continue your review at the AP Biology study hub.
Sources for further study
For the mitochondrial mechanism and carrier accounting, see OpenStax on oxidative phosphorylation and pyruvate oxidation and the cycle. The approximate ATP conversion factors are discussed in Hinkle’s review of mitochondrial P/O ratios. For gas-exchange controls, see Practical Biology’s respirometer investigation.

Related to This Article
More math articles
- TSI Math Practice Test Questions
- CLEP U.S. History I 077: Religion, Science, and Education
- Integral Approach to Cumulative Growth
- Donating money
- Grade 2 Math Practice for Iowa Second Graders
- Education
- Independent & Dependent Variables in Tables and Graphs
- 10 Most Common AFOQT Math Questions
- How to Interpret STAAR Scores?
- Enhanced ACT Math 2026: The New 45-Question Section, Explained





What people say about "Cellular Respiration: Stages and 30–32 ATP Yield"?
No one replied yet.