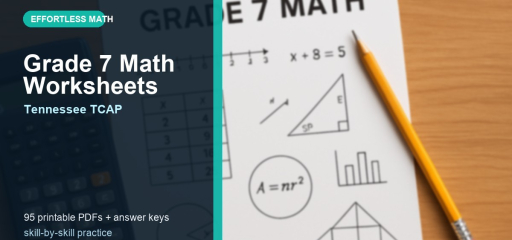
Tennessee TCAP Grade 7 Math Worksheets: 95 Free Printable PDFs with Answer Keys
By seventh grade, math is full of graphs and displays a student has to read, not just make. A proportional relationship is a line through the origin. A data set is a box plot or a histogram. A whole is a circle graph. A student in Nashville, Memphis, or Knoxville who can read these displays fluently has a real advantage, because so many Grade 7 questions hand you a picture and expect an answer.
These 95 worksheets give the reading of graphs and displays its own dedicated practice, page by page — graphing proportional relationships, box plots, histograms and stem-and-leaf plots, circle graphs. And the same single-skill design covers the rest of the year, from integers through probability.
Each PDF opens with a short review and a worked example, then builds through practice and word problems, with an explained answer key. Print the page that matches the need and keep the work focused.
What’s on this page
The worksheets are organized into the ten strands of Grade 7 math. Each title is tagged with its standard code in brackets so you can match a page to a classroom target or a TCAP reporting category. Every link opens a printable PDF: review and example, then practice and word problems, then answers with tutor notes.
Integers and Absolute Value
- Understanding Integers and the Number Line – [7.NS.1] make positive and negative numbers feel concrete before the operations begin
- Absolute Value – [7.NS.1] treat distance from zero as a habit, especially when negative signs sit outside the bars
- Comparing and Ordering Integers – [7.NS.1] use number-line position instead of guessing from the size of the digits
- Adding Integers – [7.NS.1] combine gains and losses without losing the sign
- Subtracting Integers – [7.NS.1] turn subtraction into adding the opposite when the signs get crowded
- Multiplying Integers – [7.NS.2] separate the sign rule from the multiplication facts
- Dividing Integers – [7.NS.2] use the same sign logic as multiplication, then check reasonableness
- Square Roots and Perfect Squares – [8.EE.2] recognize perfect squares quickly and connect square roots to side length
- Introduction to Scientific Notation – [8.EE.3] write very large and very small numbers in a cleaner, more readable form
Rational Numbers and Exponents
- Fractions, Decimals, and Rational Numbers – [7.NS.2] move between forms so the most useful representation is always available
- Adding and Subtracting Fractions (Like Denominators) – [7.NS.1] keep the denominator steady and focus attention on what happens to the numerators
- Adding and Subtracting Fractions (Unlike Denominators) – [7.NS.1] find a common denominator before the arithmetic starts to compete for attention
- Multiplying Fractions and Mixed Numbers – [7.NS.2] convert mixed numbers when needed, multiply straight across, and simplify cleanly
- Dividing Fractions and Mixed Numbers – [7.NS.2] turn division into multiplying by the reciprocal, then check that the size of the answer makes sense
- Adding and Subtracting Decimals – [7.NS.1] line up place values so tenths, hundredths, and thousandths stay in their own lanes
- Multiplying and Dividing Decimals – [7.NS.2] estimate first, then place the decimal where the answer can reasonably live
- Converting Between Fractions, Decimals, and Percents – [7.NS.2] switch forms on purpose instead of treating each representation as a separate topic
- Adding and Subtracting Rational Numbers – [7.NS.1] combine fractions, decimals, and negatives without letting the notation hide the operation
- Multiplying Integers and Rational Numbers – [7.NS.2] carry the sign rule into fractions and decimals, not just whole-number products
- Dividing Integers and Rational Numbers – [7.NS.2] use reciprocals and sign rules together, then test the answer against the original expression
- Solving Real-World Problems with Rational Numbers – [7.NS.3] translate everyday changes, debts, distances, and measurements into rational-number operations
- Exponents and Powers of Rational Numbers – [8.EE.1] read powers as repeated factors and watch how fractions and negatives behave
- Laws of Exponents – [8.EE.1] use product, quotient, and power rules as shortcuts students can justify, not tricks to memorize
Ratios, Rates, and Proportional Relationships
- Ratios and Equivalent Ratios – [7.RP.2] build the foundation for proportions, rates, and scale work
- Unit Rates and Complex Fractions – [7.RP.1] reduce messy comparisons to a clear per-one value
- Writing and Solving Proportions – [7.RP.2] set up equivalent ratios carefully before cross-products appear
- Proportional vs. Non-Proportional Relationships – [7.RP.2] look for a constant multiplier instead of assuming every table is proportional
- Constant of Proportionality (k) – [7.RP.2] identify the unit rate that ties tables, graphs, equations, and word problems together
- Graphing Proportional Relationships – [7.RP.2] connect the straight line through the origin to the unit rate in the situation
- Scale Drawings and Scale Factors – [7.G.1] connect classroom proportions to maps, models, and real measurements
- Writing Equations for Proportional Relationships – [7.RP.2] turn a constant rate into an equation and use it to predict new values
- Converting Between Measurement Systems – [7.RP.3] use conversion factors carefully so the unwanted unit cancels away
Percents and Financial Literacy
- Percents Greater Than 100% and Less Than 1% – [7.RP.3] stretch percent thinking beyond the familiar 0 to 100 range
- Finding the Percent of a Number – [7.RP.3] connect percent to multiplication so students can move past one-step guessing
- Finding the Whole Given a Part and Percent – [7.RP.3] work backward from the part to the original amount without swapping the quantities
- Percent Increase and Percent Decrease – [7.RP.3] separate the original amount from the amount of change
- Discounts, Markups, and Sales Tax – [7.RP.3] practice the kind of percent math students see in stores
- Simple Interest – [7.RP.3] keep principal, rate, and time organized in one formula
- Tips, Commissions, and Fees – [7.RP.3] apply percent work to bills, pay, service charges, and other money situations students recognize
- Percent Error: How Close Are Your Estimates? – [7.RP.3] compare the size of an error to the exact value, not just the raw difference
- Compound Interest – [7.RP.3] show why repeated percent growth is different from simple interest
- Introduction to Personal Financial Literacy – [7.RP.3] make budgeting, saving, borrowing, and earning feel like math students can actually use
Expressions, Equations, and Inequalities
- Writing and Evaluating Algebraic Expressions – [7.EE.2] translate words into variables and test expressions with real values
- Properties of Operations and Simplifying Expressions – [7.EE.1] combine like terms and use properties to make expressions easier to read
- Adding and Subtracting Linear Expressions – [7.EE.1] track coefficients and constants separately so like terms do not get blurred together
- Solving One-Step Equations – [7.EE.4] undo one operation cleanly and check by substitution
- Solving Two-Step Equations – [7.EE.4] remove the constant first, then undo the coefficient
- Solving Equations with the Distributive Property – [7.EE.4] distribute, collect like terms, and then solve the equation one layer at a time
- Writing and Graphing Inequalities – [7.EE.4] connect inequality language to open and closed points on a number line
- Solving One-Step and Two-Step Inequalities – [7.EE.4] solve like an equation while remembering when a negative multiplier reverses the sign
- Factoring Expressions – [7.EE.1] pull out a common factor so the structure of an expression becomes easier to see
- Rewriting Expressions to Solve Problems – [7.EE.2] choose an equivalent form that makes the question easier, faster, or clearer
- Solving Multi-Step Problems with Rational Numbers – [7.EE.3] keep fractions, decimals, signs, and units organized across several steps
- Introduction to Slope and Linear Relationships – [8.EE.5] read a rate of change from tables, graphs, and situations
Geometry: Angles, Triangles, and Transformations
- Adjacent, Vertical, and Linear Pair Angles – [7.G.5] use angle relationships before reaching for guesswork or a protractor
- Complementary and Supplementary Angles – [7.G.5] connect the words to 90-degree and 180-degree totals
- Angle Relationships with Parallel Lines and Transversals – [8.G.5] spot corresponding, alternate, and same-side angle patterns in a busy diagram
- Triangle Angle-Sum Theorem – [8.G.5] use the 180-degree total to solve for missing angles
- Exterior Angle Theorem – [8.G.5] connect an outside angle to the two remote interior angles that create it
- Constructing Triangles (SSS, SAS, ASA Conditions) – [7.G.2] test which side-and-angle information is enough to make one clear triangle
- Similar Figures and Proportional Sides – [7.G.1] use scale factors to move between matching sides
- Drawing Geometric Figures with Given Conditions – [7.G.2] turn a written set of constraints into a precise diagram
- Triangle Inequality Theorem – [7.G.2] check side lengths before assuming a triangle can exist
- Properties of Quadrilaterals – [7.G.2] sort rectangles, parallelograms, trapezoids, and rhombuses by the properties they must have
- Translations, Reflections, and Rotations – [8.G.1] describe how a figure moves without changing its size or shape
- Dilations and Scale Factors on the Coordinate Plane – [8.G.3] use multiplication from the origin or center of dilation to resize a figure
Two-Dimensional Geometry
- Area of Triangles – [7.G.6] practice the half-base-times-height idea until it is automatic
- Area of Quadrilaterals – [7.G.6] choose the right base and height for rectangles, parallelograms, trapezoids, and kites
- Area of Composite Figures – [7.G.6] break an irregular shape into familiar pieces before adding or subtracting area
- Circumference of Circles – [7.G.4] use diameter, radius, and pi to measure the distance around a circle
- Area of Circles – [7.G.4] connect radius, pi, and area without mixing up circumference
- Area and Perimeter of Composite Figures with Circles – [7.G.4] combine straight edges and curved pieces without losing track of which formula is being used
- Parts of a Circle – [7.G.4] name radius, diameter, chord, arc, and sector while doing real calculations
Three-Dimensional Geometry
- Nets and Surface Area of Prisms – [7.G.6] unfold a prism into faces so every rectangle has a reason to be counted
- Surface Area of Pyramids – [7.G.6] combine the base with the triangular faces and keep slant height separate from vertical height
- Volume of Prisms – [7.G.6] multiply base area by height and track cubic units
- Volume of Pyramids – [7.G.6] connect pyramid volume to one-third of a matching prism
- Cross Sections of 3-D Figures – [7.G.3] visualize the flat shape created when a solid is sliced
- Volume of Cylinders – [8.G.9] use the area of the circular base and the height as a three-dimensional stack
- Surface Area of Cylinders – [7.G.6] combine the two circles with the curved rectangle around the side
Statistics and Data
- Populations, Samples, and Sampling Methods – [7.SP.1] decide whether a sample represents the larger group or quietly leans one way
- Making Predictions from Samples – [7.SP.2] use proportional reasoning to make reasonable estimates from survey data
- Mean, Median, Mode, and Range – [7.SP.4] choose the right summary number for a data set
- Mean Absolute Deviation (MAD) – [7.SP.4] measure how spread out data values are from the mean
- Box Plots and Measures of Spread – [7.SP.4] read quartiles, medians, ranges, and IQR from one display
- Comparing Two Data Distributions – [7.SP.3] compare center and spread instead of judging by one number alone
- Histograms and Stem-and-Leaf Plots – [7.SP.4] read grouped data displays without mistaking bars or stems for individual values
- Circle Graphs (Pie Charts) – [7.SP.4] connect sectors of a circle to percents, fractions, and totals
Probability
- Introduction to Probability – [7.SP.5] write probability as a favorable-outcomes-over-total-outcomes fraction
- Sample Spaces and Counting Outcomes – [7.SP.8] list outcomes in an organized way so none are counted twice or missed
- Probability of Simple Events – [7.SP.6] turn one clear event into a fraction, decimal, or percent probability
- Compound Events (Independent) – [7.SP.8] multiply probabilities when one event does not change the other
- Compound Events (Dependent) – [7.SP.8] adjust the second probability when the first event changes the sample space
- Simulations and Experimental Probability – [7.SP.6] use trials to model chance and compare results with theoretical probability
- Probability Models – [7.SP.7] judge whether a model matches the situation before trusting its predictions
A practical home routine
Keep sittings brief and pointed at a single skill. The page behind a recent miss is the one to print, and fifteen focused minutes on it beats a long, unfocused review.
When an answer is wrong, have your student read the tutor note and name the slip. With graphs and displays, it is often a scale misread or a quartile confused with a median.
Before the TCAP, rotate strands across a week so display-reading gets practiced alongside computation and reasoning.
About the Tennessee TCAP Grade 7 Math test
The Tennessee Comprehensive Assessment Program expects Grade 7 students to compute with rational numbers and reason about proportional relationships, equations and inequalities, geometry, and probability. Many items present information as a graph or a data display and ask the student to interpret it correctly.
Steady worksheet practice keeps display-reading and every other skill rehearsed, so a TCAP item built around a graph reads as familiar work.
Prefer one complete resource?
For those who want a single organized download instead of separate PDFs, the Tennessee TCAP Grade 7 Math Preparation Bundle collects full-length practice tests, answer keys, and structured review.
Tennessee TCAP Grade 7 Math Preparation Bundle – 18 full-length practice tests across three books, with original questions and detailed explanations.
To close
Reading a graph well is a skill, and skills grow with steady practice. Bookmark this page, return when a display type gives trouble, and let your student build fluency with it.
Best Bundle to Ace the Tennessee TCAP Grade 7 Math
Looking for one organized Grade 7 math resource for the Tennessee TCAP? This bundle brings together full-length practice tests, answer keys, and step-by-step explanations so students can move from individual worksheet skills into complete test practice.

Related to This Article
More math articles
- 7th Grade STAAR Math FREE Sample Practice Questions
- How to Ace the GRE Quantitative Section (2026 Guide)
- Top 10 8th Grade STAAR Math Practice Questions
- Pennsylvania Keystone Algebra 1 Free Worksheets: Free Printable Keystone-Ready Algebra 1 PDFs
- The Ultimate 6th Grade OSTP Math Course (+FREE Worksheets)
- Free Grade 8 English Worksheets for Delaware Students
- How to Differentiate Trigonometric Reciprocals
- 7th Grade ACT Aspire Math Practice Test Questions
- Randomness in Action: What Slot-Style Games Teach Us About Math
- Top 10 5th Grade SBAC Math Practice Questions


What people say about "Tennessee TCAP Grade 7 Math Worksheets: 95 Free Printable PDFs with Answer Keys - Effortless Math"?
No one replied yet.