Slot Volatility Math: Standard Deviation in Plain English

When a slot is called “high volatility,” that label is doing real mathematical work. It is shorthand for a number — the standard deviation of return per spin — and that number tells you how wild the ride will be even when the long-run house edge is identical. Two slots can share the same 96% return-to-player and still feel like completely different games, because slot volatility math is about the size of the swings, not the average. This guide walks through variance, standard deviation, and what those numbers look like in dollars over a real session.
Variance and standard deviation, defined without jargon
Variance measures how far outcomes spread out from their average. For a single spin where X is the net return per dollar bet, the formula is:
Variance = E[X2] − (E[X])2
E[X] is the expected value — the long-run average return. E[X2] is the expected value of the squared return. Subtract the squared average from the average of the squares, and you have variance. Standard deviation is just the square root of variance, which gets you back into the same units as the bet itself. That second step matters because variance is in “dollars squared,” which nobody thinks in. Standard deviation in dollars per spin or per session is the number you actually care about.
One sentence summary: expected value tells you where the center of the distribution sits, and standard deviation tells you how fat the distribution is around that center.
Volatility ratings and the std dev ranges behind them
Slot manufacturers and review sites usually publish a volatility rating — low, medium, or high — without giving you the underlying standard deviation. The ratings are not regulated and not perfectly consistent across providers, but they do map roughly onto std dev ranges per unit bet.

| Volatility rating | Approximate std dev per spin | What it feels like |
|---|---|---|
| Low | ~2× to 3× the bet | Frequent small wins, rare big hits, slow bankroll changes |
| Medium | ~4× to 7× the bet | Mixed pacing, occasional bigger wins, moderate swings |
| Medium-high | ~7× to 10× the bet | Longer dry spells, larger wins when they hit |
| High | ~10× to 15× the bet | Long droughts punctuated by rare large payouts |
These numbers are typical, not guaranteed. A specific high-volatility slot might land at std dev of 12 per dollar bet; another might sit at 18. The point of the table is the rough scale, so you can compare a “high vol” slot to a roulette bet (std dev around 1 per dollar on even-money bets) and see that slots live in a different universe of swing size.
Worked example: a 3-symbol pretend slot
Real slot math involves thousands of outcomes across many reels. To see the mechanics, here is a stripped-down pretend slot with one reel and three possible outcomes per $1 spin:
- Lose your dollar (net X = −1) with probability 0.80
- Win $4 net (X = +4) with probability 0.18
- Win $50 net (X = +50) with probability 0.02
Expected value: E[X] = (0.80)(−1) + (0.18)(4) + (0.02)(50) = −0.80 + 0.72 + 1.00 = 0.92. That is a net +$0.92 per spin on average, which would be a player-favorable game. Set that aside; we are after the volatility number.
E[X2] = (0.80)(1) + (0.18)(16) + (0.02)(2500) = 0.80 + 2.88 + 50 = 53.68.
Variance = 53.68 − (0.92)2 = 53.68 − 0.8464 ≈ 52.83.
Standard deviation = √52.83 ≈ 7.27 per $1 spin.
That single rare $50 outcome dominates the variance. If you removed it and redistributed the probability to the small win, expected value would drop, but variance would collapse much more dramatically. This is the core lesson of slot volatility math: a small handful of giant payouts is what makes a slot “high vol,” because squaring large outcomes inflates the variance term hard.
What a one-, two-, and three-std-dev session looks like in dollars
Per-spin std dev is the building block. For a session, results scale by the square root of the number of spins. If σ is std dev per spin and you play N spins, session std dev is σ·√N, while expected loss grows linearly with N.
Take a high-volatility slot at $1 per spin with a 96% return-to-player (so house edge is 4%, expected loss is $0.04 per spin) and assume per-spin std dev around 10.
- 1,000 spins: expected loss = 1000 × $0.04 = $40. Session std dev = 10 × √1000 ≈ $316.
- One std dev band: roughly between $276 ahead and $356 behind.
- Two std dev band: roughly $592 ahead to $672 behind.
- Three std dev band: roughly $908 ahead to $988 behind.
The expected outcome is a $40 loss. The realistic range of outcomes is hundreds of dollars in either direction. A player walking away $250 up after 1,000 spins on this slot is well inside one standard deviation; nothing unusual happened. A player walking away $900 down is near the edge of three std deviations — rare but absolutely consistent with the underlying math.
Compare that to a low-volatility slot at the same bet and RTP with per-spin std dev of 3. After 1,000 spins, expected loss is still $40, but session std dev is only about $95. Your range of likely outcomes is much narrower, which is the whole point of low-vol games.
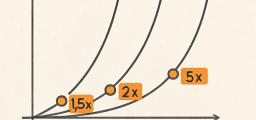
How volatility scales with bet size
This is where players underestimate the math. Doubling the bet doubles expected loss, but it also doubles the standard deviation in dollar terms. The ratio of swing to expected loss stays the same — except your bankroll is fixed, so a doubled swing is much more likely to bust it.
Same high-vol slot, same 1,000 spins, but at $5 per spin instead of $1:
- Expected loss = $200.
- One std dev = $1,580.
- Three std dev = $4,740.
If your session bankroll is $500, a $5 bet on a high-vol slot will frequently produce losses larger than your bankroll before you reach 1,000 spins. The math hasn’t changed; the relationship between volatility and bankroll has. This is the practical reason high-vol slots demand smaller bet sizing relative to bankroll, not bigger.
Volatility and hit frequency are not the same
Hit frequency is the percentage of spins that return any win at all, even a fraction of the bet. A slot can have a high hit frequency and still be high volatility if its prize structure is heavily skewed — lots of small wins that return less than the bet plus rare jackpots. A different slot can have low hit frequency but medium volatility if its wins are tightly clustered around modest multiples.
Two slots, same RTP:
- Slot A: hits on 35% of spins, mostly returning 0.4× to 1.5× the bet, with no large jackpot tier. Low std dev.
- Slot B: hits on 28% of spins, mostly returning small amounts, with a rare 1,000× bonus round. High std dev.
Slot B feels rarer in terms of “win” frames, but the deeper reason it’s volatile is the squared contribution of that 1,000× event to variance. Hit frequency tells you how often the screen flashes “WIN”; volatility tells you how much it actually matters.
There is also a related trap with “average win size.” Some review pages quote the mean payout conditional on a hit, which can look reassuring on a high-vol slot — say, an average win of 8× the bet. That number hides the fact that most hits are small and a few are enormous. The mean is being dragged up by the same rare events that drive variance. If you want a sense of typical experience, the median win size is far more informative, but it is almost never published. Std dev plus RTP plus hit frequency together give a much better profile than any single statistic.
Choosing volatility by bankroll and session goal
Once volatility is a number, picking a slot becomes a budget question, not a vibe question. A few useful rules of thumb:
- Short session, fixed entertainment budget, want to play a long time: low volatility. Std dev per spin around 2–3 keeps your bankroll closer to its expected slow decline.
- Medium bankroll, willing to ride swings, want occasional bigger wins: medium volatility. Std dev around 4–7 per bet.
- Larger bankroll relative to bet, chasing the rare big hit, can stomach long dry spells: high volatility. Std dev 10+ per bet, with bet sizing low enough that three std deviations still doesn’t bust the session.
- If you cannot afford a three-std-dev losing session at your chosen bet, your bet is too high for that slot. Cut the bet or pick a lower-vol slot.
None of this changes the expected value. You will still lose the house edge over time. Volatility selection is about controlling the shape of the loss, not eliminating it. For a different math-meets-money topic, the breakdown at EffortlessMath covers the underlying probability concepts in more depth.
One more practical note: session length interacts with volatility in a way many players miss. On a low-vol slot, a 30-minute session and a 3-hour session both feel like grinding through the house edge, because std dev is small and the bankroll trajectory looks like a noisy downward slope. On a high-vol slot, a short session is essentially a coin flip on whether the bonus round triggers at all. Two players at the same machine for 200 spins each can walk away with wildly different stories — one bored and down $80, the other up $400 — and both results are completely ordinary given the std dev. Knowing this in advance is what keeps the high-vol experience from feeling like the machine is “rigged” against you on a bad night.
For regulator-side rules on how slot returns are reported and tested, the UK Gambling Commission publishes operator obligations, and the Wizard of Odds slot section works through specific game math with verified payout tables.
FAQ
Q: Does a higher volatility slot have a worse house edge?
A: Not directly. House edge is determined by RTP, which is independent of volatility. A 96% RTP low-vol slot and a 96% RTP high-vol slot have the same expected loss per dollar wagered. The high-vol slot just gets there with bigger swings.
Q: Can I use volatility to “time” when a slot is due to hit?
A: No. Slot spins are independent. A long dry spell on a high-vol slot doesn’t make the next spin more likely to hit. Volatility describes the distribution; it doesn’t create patterns the player can exploit.
Q: Why is std dev usually given as a multiple of the bet?
A: Because it scales linearly with bet size. Expressing it per unit bet (e.g., σ ≈ 10 per $1) lets you instantly compute the dollar std dev for any bet by multiplying.
Q: How many spins do I need before results “average out”?
A: The catch is that they never fully average out for a finite session. Expected loss grows with N, but std dev grows with √N, so the ratio of swing to expected loss shrinks slowly. After 10,000 spins on a high-vol slot, std dev is about 3.16× what it was at 1,000 — still large in absolute dollars, just smaller relative to total wagered.
Q: Is bonus round volatility separate from base game volatility?
A: In practice yes. Bonus rounds usually carry most of a slot’s total variance, especially on high-vol games where the bonus is where the rare large payouts live. Some review sites publish base-game and bonus-game RTP separately for this reason. If a slot advertises a 96% RTP but most of that return is locked behind a bonus that triggers once every 200 spins, the base-game experience for short sessions will feel much worse than the headline RTP suggests, and the std dev calculation has to account for that gap.
Gambling outcomes are uncertain; no strategy guarantees profit.

Related to This Article
More math articles
- Grade 2 Math Practice for Maine Second Graders
- The Best Grade 5 Math Book for Massachusetts Students
- 4th Grade FSA Math Practice Test Questions
- What is the Best Calculator for the ACT Math Test?
- How to Identify One-by-One Functions from the Graph
- System of Equations Calculator (2×2, Free)
- How to Solve Absolute Value Equations: Step-by-Step Guide for 2026
- How to Instill in Your Child a Love of Math at School: Tips for Parents
- How to graph Scatter Plots? (+FREE Worksheet!)
- Praxis Mathematics Content Knowledge Flashcards


What people say about "Slot Volatility Math: Standard Deviation in Plain English - Effortless Math"?
No one replied yet.