Interpreting Cell-Cycle Experiments: Data and Worked Examples
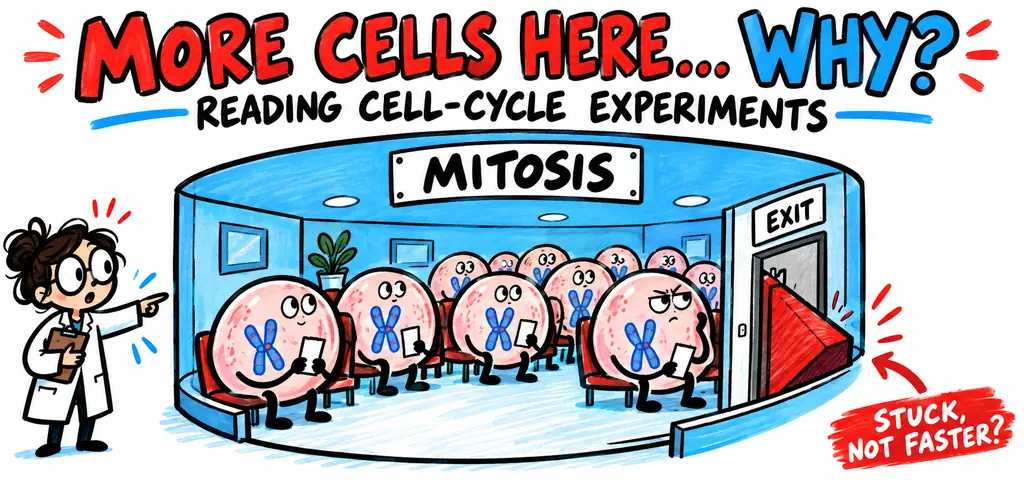
A cell-cycle experiment may give you a table of phase counts, a DNA-content histogram, or a record of protein abundance over time. These measurements answer different questions. Use phase counts to estimate how cells are distributed, DNA content to identify replication status, and additional observations to distinguish phases that contain the same amount of DNA.
Watch the process
AP Biology: Cell Cycle; Mitosis – Investigation 7
Estimating Duration from a Phase Fraction
For the classroom duration estimate, divide the number of cells in a phase by the total cycling cells sampled, then multiply by the cycle length. Use this when the question explicitly assumes that sampled fractions approximate time fractions.
The sample should be representative, sufficiently large, and asynchronous, meaning cells are at different stages rather than moving together through the cycle. Those conditions alone do not make the formula exact: an exponentially growing population contains relatively more young cells, and nondividing cells or selective death can alter the counts. You do not need an advanced correction unless supplied; you do need to recognize the assumption.
The mitotic index is this idea packaged as one number: the fraction, or percentage, of cells in a sample that are in mitosis. A high mitotic index can reflect increased entry into mitosis, delayed exit, or changes in the sampled population, and telling those apart requires more than one measurement.
Comparing Two Treatments With a Mitotic Index
Root tips from the same species are scored in three conditions. Untreated: 24 of 300 cells in mitosis. Treatment X: 96 of 400 cells in mitosis. Treatment Y: 6 of 300 cells in mitosis. Compute the mitotic index for each, express X and Y relative to the control, and state what each result suggests.
Compute each index as counted cells in mitosis divided by total cells scored. Convert to a percentage so the three are comparable despite the different sample sizes. \[\mathrm{MI}_{\text{control}} = \frac{24}{300} = 0.080 = 8.0\%\] \[\mathrm{MI}_{X} = \frac{96}{400} = 0.240 = 24.0\%, \qquad \mathrm{MI}_{Y} = \frac{6}{300} = 0.020 = 2.0\%\] Now express each treatment as a ratio to the control, which is what the interpretation actually rests on: \[\frac{24.0}{8.0} = 3.0 \times, \qquad \frac{2.0}{8.0} = 0.25 \times .\] Treatment X triples the proportion of cells caught in mitosis; treatment Y cuts it to a quarter.
Consider both increased entry and delayed exit before interpreting the proportion. Treatment X could lengthen or block mitosis relative to the rest of the cycle, so more cells are caught in it at any instant. A drug that prevents spindle microtubules from attaching does exactly this. Treatment Y could block cells somewhere before mitosis, so fewer arrive, which is what an arrest at G\(_1\) or G\(_2\) looks like from this measurement.
Notice what neither result tells you. A mitotic index is a proportion, not a count of dividing cells, so a tripled index does not mean three times as many divisions are being completed. If X arrests mitosis, cells enter and remain there, and the number of completed divisions can fall even as the index rises. The index alone does not measure the rate of completed divisions.
Answer
8.0 percent, 24.0 percent, and 2.0 percent; X triples the proportion, consistent with a longer mitosis, and Y quarters it, consistent with an arrest before mitosis.
Using DNA Content to Narrow the Phase
A second common data form measures the amount of DNA in each individual cell and plots how many cells had each amount. Use two labels. For a diploid cell line, call the DNA content of an unreplicated cell \(2C\) and that of a fully replicated one \(4C\), where \(C\) is the DNA in one unreplicated set.
A G\(_1\) cell sits at \(2C\). A G\(_2\) or M cell sits at \(4C\). An S-phase cell is caught partway through replication, so it sits somewhere between the two, which is why an S-phase population shows up as a low, broad region between two peaks rather than as a peak of its own. The relative heights depend on the sampled phase distribution; DNA content alone does not separate G\(_0\) from G\(_1\) or G\(_2\) from M.
An increased \(2C\) fraction after treatment can support a block before replication, but it can also reflect entry into G\(_0\) or selective loss of other cells. An increased \(4C\) fraction suggests delayed progression after replication; microscopy can distinguish G\(_2\) from mitosis. Intermediate values include normal S-phase cells as well as cells delayed during replication. Values above \(4C\) can indicate additional replication without division, but cell clumps and other technical artifacts must be excluded. Compare treated and untreated cultures and check viability before assigning a mechanism.
Two Drugs, Two Histograms
A cultured cell line normally shows 55 percent of cells at \(2C\), 15 percent between \(2C\) and \(4C\), and 30 percent at \(4C\). After 18 hours in drug A, 92 percent of cells are at \(2C\) and the region between the peaks is nearly empty. After 18 hours in drug B, 88 percent are at \(4C\). A microscope check of the drug B sample finds that fewer than 1 percent of the cells have condensed chromosomes. Identify where each drug acts and justify each conclusion.
Claim. Drug A blocks the cycle before or at the start of S phase. Drug B blocks it after replication but before mitosis, at G\(_2\).
Evidence. Under drug A the \(2C\) peak grows from 55 to 92 percent and the intermediate region empties. Under drug B the \(4C\) peak grows from 30 to 88 percent, and almost no cells show condensed chromosomes.
Reasoning. Cells accumulate at whatever point they cannot pass, so the peak that grows marks the block. For drug A, the accumulation at unreplicated DNA content plus the emptied intermediate region shows that cells are not entering S phase at all; if the drug slowed replication instead, cells would pile up between the peaks rather than below them.
For drug B, the \(4C\) peak alone would leave two possibilities, G\(_2\) arrest or mitotic arrest, since a mitotic cell also has \(4C\) DNA. This is where the second measurement earns its place. Chromosome condensation is a mitotic event, and fewer than 1 percent of cells show it, so the cells are not in mitosis. That leaves G\(_2\). Whenever a DNA-content histogram gives you an ambiguous answer, look for the independent observation the stem supplies; it is there to break exactly that tie.
Conclusion
Drug A arrests cells before S phase and drug B arrests them in G\(_2\); the DNA histogram locates each block, and the absence of condensed chromosomes rules out mitotic arrest for drug B.
Identifying S Phase with a Labeling Pulse
A third design gives cells a brief pulse of a labeled nucleotide precursor, which is incorporated into DNA synthesized during the pulse. In this model, nuclear replication dominates incorporation and DNA repair is negligible. Cells that were in S phase during the pulse end up labeled; cells in G\(_1\), G\(_2\), or M do not.
The fraction of cells labeled by a short pulse estimates the fraction of the cycle that is S phase, the same logic as a mitotic index. Following the labeled cells over the next several hours does more. Wait, sample, and ask when labeled cells first appear in mitosis: that interval estimates the length of G\(_2\), because it is the time a cell needs to travel from the end of S phase to mitosis. This is one of the few ways to measure the duration of a single phase directly rather than by proportion.
Review: Reading Cell-Cycle Experiments
A snapshot of a population encodes the timing of a process, because cells accumulate wherever they spend time or wherever they are blocked.
Change a phase’s length and you change the proportion of cells found in it, without changing anything about how many cells exist.
Do not read a rising proportion as a rising rate. A tripled mitotic index can result from arrest; it does not establish faster division.
Distinctions to keep clear
A proportion is not a total cell number. The phase fractions and mitotic indices here report shares of a population. If a treated sample has a higher percentage of mitotic cells, that says mitosis occupies a larger share of each cell’s time or that cells are stuck there. It says nothing on its own about whether the tissue contains more cells or is growing faster. To claim a growth rate you need a count over time, not a snapshot.
Arrest and death require different supporting evidence. Accumulation at one DNA content is consistent with arrest, whereas loss of viable cells or fragmented DNA can support cell death. A single DNA-content percentage does not prove either interpretation. Those are different claims about a drug, and stems distinguish them by including a viability measurement or a count of total cells.
Interpreting cell-cycle data
Practice question 1
A DNA-content histogram of a treated culture shows 90 percent of cells at the fully replicated (\(4C\)) DNA content, and microscopy shows almost no condensed chromosomes. These cells are most likely arrested in
-
G\(_1\)
-
S phase
-
G\(_2\)
-
anaphase
Practice question 2
A tissue’s mitotic index rises from 6 percent to 30 percent after treatment with a spindle poison. The best interpretation is that the treatment
-
increased the rate at which cells complete division
-
increased the total number of cells in the tissue fivefold
-
blocked cells within mitosis, so cells accumulate there and the proportion caught in mitosis rises
-
shortened interphase without affecting mitosis
Practice question 3
A short pulse of a labeled DNA precursor labels 20 percent of the cells in an asynchronous culture whose cycle length is 20 hours. Assuming the fraction labeled estimates the fraction of the cycle spent in S phase, the length of S phase is about
-
2 hours
-
4 hours
-
10 hours
-
16 hours
Practice answer key
1. C; 2. C; 3. B.
Practice answer explanations
-
Interpreting cell-cycle data, Question 1. Choice C is correct. Fully replicated DNA places the cells after S phase, and the absence of condensed chromosomes rules out mitosis, which leaves G\(_2\). Choice A would show cells at the unreplicated DNA content. Choice B would show cells spread between the two peaks rather than piled at the upper one. Choice D would put the cells in mitosis, which the microscopy result excludes.
-
Interpreting cell-cycle data, Question 2. Choice C is correct. A spindle poison holds cells at the metaphase-to-anaphase transition, so cells enter mitosis and cannot leave it, and the proportion caught in mitosis climbs even though divisions are not being completed. Choice A reads a proportion as a rate and gets the direction exactly backward. Choice B confuses the share of cells in a phase with the total number of cells. Choice D would raise the mitotic index by shortening interphase, but a spindle poison acts within mitosis, not on interphase.
-
Interpreting cell-cycle data, Question 3. Choice B is correct. The labeled fraction is \(0.20\), so S phase occupies \(0.20 \times 20 = 4\) hours. Choice A applies a fraction of \(0.10\). Choice C applies a fraction of \(0.50\), and Choice D applies \(0.80\); neither matches the 20 percent reported.
Continue your review at the AP Biology study hub.
Further reading: The cell-cycle flow cytometry methods review explains why DNA-content measurements distinguish G1, S, and G2/M groups. Additional evidence is needed to separate G2 from mitosis.

Related to This Article
More math articles
- How to Solve Quadratic Equations: 4 Methods Explained
- The Best Algebra 1 Book for West Virginia Students
- Comprehensive Tests for Convergence and Divergence of Infinite Series
- How to Manage Your Time Effectively on the GED Math Test?
- The Ultimate SAT Math Formula Cheat Sheet
- The Best Grade 4 Math Book for Montana Students
- Why Project-Based Learning Works So Well for Students
- Top 10 7th Grade STAAR Math Practice Questions
- Smarter Balanced Grade 4 Math Free Worksheets: 72 Printable Standards-Aligned PDFs with Answer Keys
- Socialization, Inequality, and Agency











What people say about "Cell-Cycle Experiments: Data and Worked Examples"?
No one replied yet.