Enzyme Kinetics: Km, Vmax and Inhibition
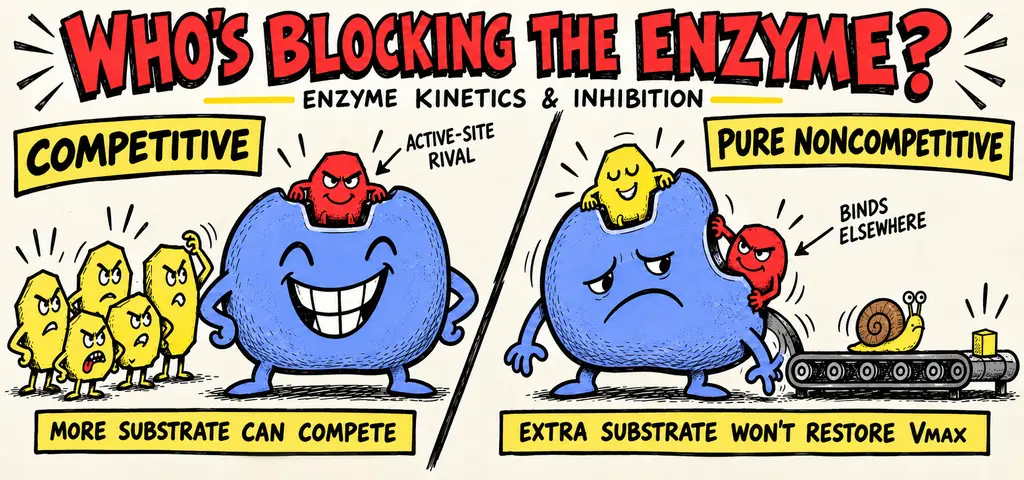
Enzyme kinetics describes how reaction rate changes with substrate concentration and inhibition. In the simple Michaelis–Menten model, Km is the substrate concentration at half of Vmax. Competitive inhibition raises apparent Km without lowering Vmax; pure noncompetitive inhibition lowers Vmax without changing apparent Km.
In a supervised laboratory assay, catalase in a piece of potato speeds the breakdown of hydrogen peroxide into water and oxygen. The enzyme lowers the activation-energy barrier; it does not change the reaction’s overall free-energy change or equilibrium.
Watch the process
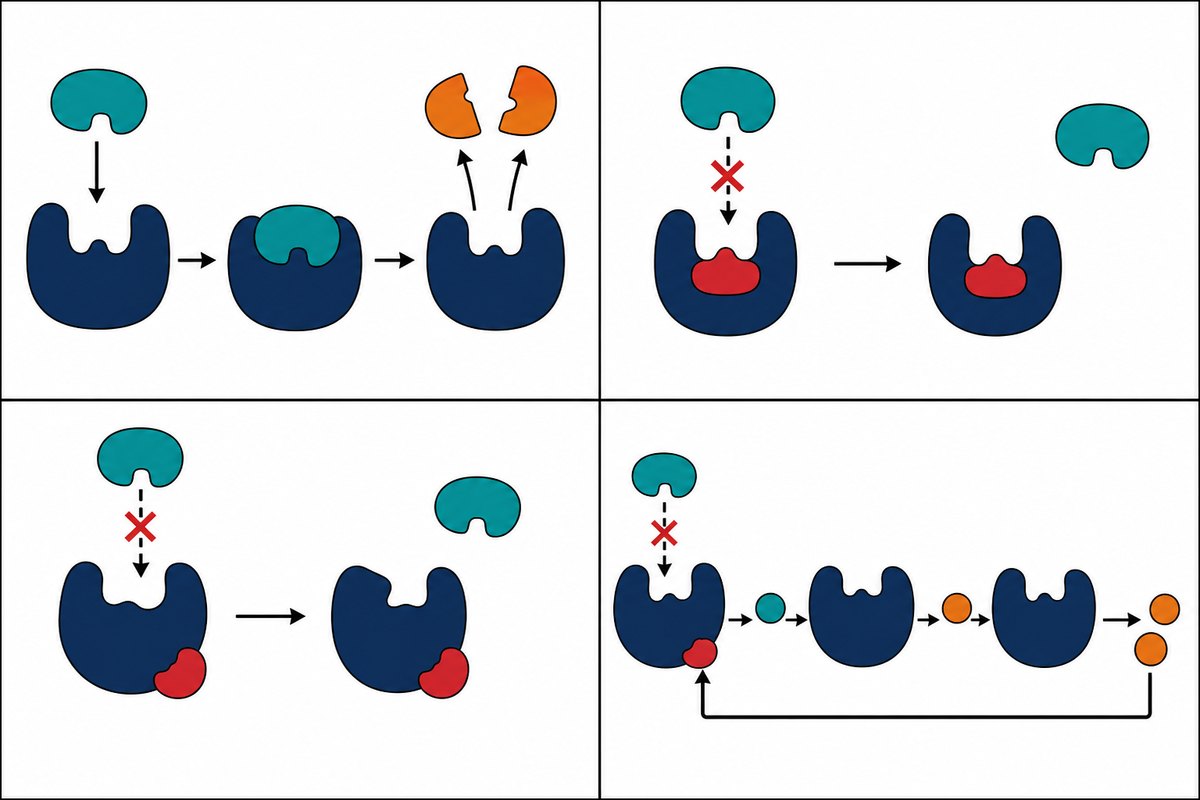
Enzyme Examples, Cofactors/Coenzymes, Inhibitors, and Feedback Inhibition
Keep reaction rate separate from free-energy change. An enzyme can accelerate a reaction without changing its equilibrium or overall free-energy change.
A favorable reaction still needs a push to start. Reactants must collide in the right orientation with enough energy to reach an unstable transition state, and the size of that hill is the activation energy. Temperature affects reaction rate in cells as well as in laboratory vessels. Excessive heating can damage cellular components, so enzymes provide a lower-barrier pathway at conditions compatible with cell function.
An enzyme is a biological catalyst, almost always a protein and occasionally an RNA, that lowers the activation energy of a specific reaction and emerges unchanged. Read the last three words twice. The enzyme is not consumed, so one molecule turns over substrate after substrate, thousands of times a second in some cases. And note what an enzyme does not do. It does not change \(\Delta G\), it does not change the equilibrium position, and it cannot by itself make an endergonic net reaction favorable. It changes only how fast equilibrium is reached, and it speeds the forward and reverse directions by the same factor.
The Active Site and Induced Fit
The active site is a pocket, usually a small fraction of the protein’s surface, formed when the chain folds and lined by side chains whose charge, polarity, and shape complement a particular substrate. That complementarity is where enzyme specificity comes from, and it is a direct consequence of the protein’s amino-acid sequence.
The older lock-and-key picture treats the site as rigid. The accepted model is induced fit: substrate binding changes the shape of the active site, tightening it around the substrate and straining the bonds about to react. That distinction explains catalysis rather than just binding. An induced-fit site can orient two substrates, strain a bond toward its transition state, or supply and withdraw protons through its side chains, and each of those lowers activation energy without adding energy to the reaction.
Some enzymes cannot work alone. A cofactor is a nonprotein helper, typically an inorganic ion such as \(\text{Mg}^{2+}\) or \(\text{Zn}^{2+}\), that completes the active site. A coenzyme is an organic cofactor, often derived from a vitamin; \(\text{NAD}^+\) and FAD, which carry electrons in metabolic reactions, are coenzymes. An enzyme stripped of its required cofactor loses activity while remaining perfectly folded, so cofactor loss and denaturation are different possible causes of low activity.
What Changes the Rate
Four variables control enzyme rate, and each behaves differently.
Substrate concentration. At low substrate the rate rises nearly in proportion, because most sites are empty and collisions limit the reaction. As sites fill, the curve bends, and at saturation every site is reoccupied the instant it frees up, so the rate plateaus at \(V_{\max}\).
Enzyme concentration. With substrate in excess, doubling the enzyme doubles the rate and doubles \(V_{\max}\), because \(V_{\max}\) measures how much catalytic capacity is present.
Temperature changes molecular motion as well as enzyme stability, while pH changes protonation and can affect both catalysis and folding; and each can produce an activity optimum, with the shape depending on the enzyme, exposure time, and assay conditions. These effects differ from changing how much substrate or enzyme is available. Substrate and enzyme concentration change how often the reaction happens. Temperature and pH can change activity even while the overall fold remains intact; more extreme conditions may denature the enzyme.
The enzyme’s catalytic turnover also matters. Enzymes differ enormously in turnover number, the number of substrate molecules one enzyme molecule converts per second. Turnover depends on the enzyme, substrate and assay conditions; a single value should not be assigned to every catalase preparation. When a stem says a pathway step is slow, several causes are possible, including limited substrate, enzyme amount, transport, or catalytic turnover. Identify the limiting cause from evidence.
Useful Extension
These symbols describe a supplied saturation model. Learn saturation and inhibition first; use the definitions provided here when interpreting the extra examples.
Reading \(K_m\) and \(V_{\max}\)
A saturation curve carries two numbers. \(V_{\max}\) is the maximum rate approached when substrate saturates the enzyme present. \(K_m\), the Michaelis constant, is the substrate concentration that produces exactly half of \(V_{\max}\). For simple Michaelis–Menten behavior, a lower \(K_m\) means half-maximal rate at a lower substrate concentration. It is sometimes described as higher apparent affinity, but \(K_m\) is not a universal binding constant: catalytic rates also affect it. This kinetic notation is an extension for reading supplied data, not a reason to replace the core AP ideas of specificity, saturation, and inhibition.
Pulling \(V_{\max}\) and \(K_m\) Out of a Data Table
A fixed amount of enzyme is assayed at a series of substrate concentrations. The initial rates are:
| \([\text{S}]\) (mM) | Initial rate (micromol/min) |
|---|---|
| 1 | 18 |
| 2 | 30 |
| 5 | 50 |
| 10 | 64 |
| 20 | 75 |
| 40 | 82 |
| 80 | 86 |
| 160 | 88 |
Determine \(V_{\max}\) and \(K_m\), then predict how each would change under a competitive inhibitor and under a pure noncompetitive inhibitor.
Find \(V_{\max}\) first. Look for the plateau, not the largest number in isolation. From \(40\) to \(80\) to \(160\) mM the rate moves 82, 86, 88 even though substrate quadruples, so the increments are collapsing toward zero and the curve is flattening. Take \(V_{\max} \approx 90\ \text{micromol/min}\).
Then find \(K_m\). Half of \(V_{\max}\) is \(45\ \text{micromol/min}\). Scan the rate column for 45. It falls between \(30\) (at \(2\) mM) and \(50\) (at \(5\) mM), closer to 50, so \(K_m\) is a little below \(5\) mM. Reading a plotted curve would give roughly \(4\) mM. The order of operations matters: you cannot find \(K_m\) without \(V_{\max}\), and a student who guesses \(V_{\max}\) from the highest measured rate before the plateau will report a \(K_m\) that is too low.
Competitive inhibitor. In the simple competitive model, inhibitor and substrate cannot occupy the active site simultaneously, so they compete for the same pocket. Flooding the system with substrate outcompetes the inhibitor, so the enzyme still reaches the same plateau: \(V_{\max}\) is unchanged near \(90\). But more substrate is needed to reach any given rate, so half-maximal velocity arrives later. \(K_m\) rises, perhaps to \(12\) mM. In the table, the low-substrate rows would fall sharply while the highest-substrate rows would still be climbing toward the same plateau near \(90\).
Pure noncompetitive inhibitor. A noncompetitive inhibitor binds a site other than the active site and changes the enzyme’s conformation so that catalysis is impaired. Adding substrate cannot displace it, because substrate does not compete for that site. Effectively some enzyme is removed from service, so the plateau falls: \(V_{\max}\) drops, perhaps to \(60\). In the pure noncompetitive model, the inhibitor binds free enzyme and the enzyme, substrate complex equally well. The apparent \(K_m\) therefore stays near \(4\) mM and half-maximal velocity is now \(30\ \text{micromol/min}\).
Answer
\(V_{\max} \approx 90\ \text{micromol/min}\) and \(K_m \approx 4\) mM. Competitive inhibition raises \(K_m\) and leaves \(V_{\max}\) unchanged; pure noncompetitive inhibition lowers \(V_{\max}\) and leaves \(K_m\) unchanged.
AP Core
Return to enzyme regulation: explain how effectors and pathway products change activity. Allosteric regulation describes how binding at a regulatory site changes activity. Inhibition categories describe kinetic behavior, so the location of a binding site alone does not identify the kinetic model. An allosteric site is a regulatory pocket away from the active site, and binding there shifts the protein between more and less active conformations. Allosteric activators exist too, so the mechanism can raise output as easily as lower it, and because an effector may change affinity, rate, or both, its kinetic signature is not always the clean noncompetitive pattern.
Feedback inhibition puts allostery to work on a pathway. The end product binds an allosteric site on the enzyme catalyzing an early committed step and slows it, so the pathway throttles itself as product accumulates and releases the throttle as product is consumed. That is negative feedback built from one protein, and it is why cells do not waste substrate making what they have.
A worked instance is worth carrying. In bacteria, the amino acid isoleucine is made from threonine in five enzymatic steps. Isoleucine binds an allosteric site on threonine deaminase, the enzyme of the first step, and slows it. As isoleucine is consumed in protein synthesis, it leaves the allosteric site and the pathway resumes. Notice which step is inhibited. Blocking the first committed step stops production without stranding intermediates halfway along the line, which is exactly what blocking the last step would do.
Compare Competitive, Pure Noncompetitive and Mixed Inhibition
| Model | Apparent Km | Vmax |
|---|---|---|
| Competitive | Increases | Unchanged |
| Pure noncompetitive | Unchanged | Decreases |
| Mixed | Can increase or decrease | Decreases |
Compare initial-rate curves across substrate concentrations. A reduced plateau alone does not distinguish pure noncompetitive inhibition from mixed inhibition or loss of active enzyme. The unchanged Km prediction requires the pure model’s equal inhibitor affinity for free enzyme and the enzyme–substrate complex.
Distinctions to keep clear
Competitive and pure noncompetitive inhibition affect enzyme kinetics differently. Students who learn them as a list of which constant changes tend to reverse it under pressure. Learn the mechanism instead and the constants follow. A competitive inhibitor is in the active site, so it is a matter of who gets there first, and flooding the system with substrate wins the argument. Because the enzyme can still be fully occupied by substrate at high concentration, \(V_{\max}\) is untouched; because it takes more substrate to get halfway there, \(K_m\) rises. In the pure noncompetitive model, inhibitor binds free enzyme and the enzyme–substrate complex equally well and lowers catalytic capacity, so \(V_{\max}\) falls, while the model leaves the apparent Michaelis constant unchanged, so \(K_m\) is unchanged.
Inhibition and denaturation describe different changes to enzyme function. Inhibition does not require the enzyme to unfold. Removing or diluting a reversible inhibitor may restore activity. A denatured enzyme has lost its fold; some proteins can refold when conditions are restored, while others aggregate or remain inactive. Failure to recover could reflect persistent denaturation, an irreversible inhibitor, or another lasting injury. Recovery alone does not identify the molecular mechanism. The same distinction covers cofactors: removing a required \(\text{Mg}^{2+}\) can lower activity without necessarily unfolding the enzyme; adding it back tests whether the effect is reversible.
Review: Enzymes: Active Sites, Kinetics, and Inhibition
An enzyme lowers the activation-energy barrier for one reaction and comes out unchanged, so it sets rate and never direction.
Rate rises with substrate until every active site is busy, and then plateaus at \(V_{\max}\); \(K_m\) is the substrate concentration that gives half of that plateau.
Never write that an enzyme lowers \(\Delta G\), shifts the equilibrium, or is used up. And check whether an inhibitor sits in the active site before you decide which constant moved.
Designing an Enzyme-Perturbation Experiment (Science Practices 3 and 5)
You are given catalase, hydrogen peroxide, a water bath, buffers spanning pH 3 through pH 11, and a way to measure the volume of oxygen gas produced per minute. A classmate proposes that a compound extracted from a plant, call it compound Z, inhibits catalase competitively. Design an experiment that could distinguish competitive from noncompetitive inhibition, and state what each hypothesis predicts.
Identify the variables before anything else. The independent variable is substrate concentration, the concentration of hydrogen peroxide, set at a series of levels spanning low to saturating. The dependent variable is the initial reaction rate, measured as milliliters of oxygen produced per minute over the first thirty seconds, before substrate depletion bends the curve. Compound Z is present or absent, which makes this a two-treatment design run across the same substrate series.
Say why initial rate and not total oxygen. Gas collected after ten minutes reflects how much substrate there was, not how fast the enzyme works, so rate must be taken while substrate is still in excess. An initial-rate measurement makes comparisons less sensitive to substrate depletion.
Controls and constants. The control group is the identical substrate series with the solvent that carried compound Z but no compound Z, so that any solvent effect is subtracted rather than attributed to Z. Hold constant the enzyme concentration, the temperature, the buffer pH, the reaction volume, and the timing of measurement. Include a no-enzyme tube to confirm that hydrogen peroxide is not decomposing appreciably on its own, since uncatalyzed decomposition would inflate every rate.
Replication and uncertainty. Run at least three trials per concentration per treatment, plot the means, and add error bars of one standard error, \(SE_{\bar{x}} = s/\sqrt{n}\), where \(s\) is the standard deviation of the trials at that point and \(n\) is the number of trials. The standard error estimates how far a mean of \(n\) trials is likely to sit from the true mean, so it shrinks as you run more trials. One-standard-error bars do not provide a universal significance test. State what the bars represent and use an appropriate comparison of replicate data; overlap does not automatically establish no difference, and nonoverlap does not supply an exact p-value.
Predicted data. If compound Z is a competitive inhibitor, the treated curve sits below the control at low peroxide but converges on the same plateau at high peroxide: \(V_{\max}\) unchanged, \(K_m\) increased. If compound Z is a pure noncompetitive inhibitor, the treated curve is depressed at every substrate concentration and plateaus lower, and no amount of added peroxide closes the gap: \(V_{\max}\) decreased, \(K_m\) unchanged. A third outcome is possible and worth naming: if the treated rate is near zero at all concentrations and does not recover on dilution, compound Z may be an irreversible inhibitor or may have denatured the enzyme, and the rate data alone cannot tell those apart from strong noncompetitive inhibition.
Answer
Vary substrate, measure initial rate, control with the solvent alone, and compare plateaus. Convergence at high substrate supports a competitive model. A lower plateau requires further comparison: pure noncompetitive inhibition leaves apparent Km unchanged, while mixed inhibition changes it. These curves support a kinetic model; they do not directly locate a binding site or prove permanent enzyme damage.
Memory Hook: Competitive Can Be Outvoted
A competitive inhibitor competes for the active site, and a competition can be won by showing up in greater numbers, so more substrate restores the top speed. \(V_{\max}\) survives; \(K_m\) climbs because you needed more substrate to get halfway. A noncompetitive inhibitor is not in the race at all. It sits elsewhere and disables the runner, and extra substrate cannot vote it out, so the top speed itself falls while apparent Km stays unchanged in the pure model. Competitive changes the price of half speed; noncompetitive changes the speed limit.
Enzyme kinetics and inhibition
Practice question 1
An inhibitor is added to an enzyme assay. At low substrate concentration the rate is much lower than the control, but at very high substrate concentration the treated and control rates converge on the same maximum. The inhibitor is best described as
-
noncompetitive, because the treated rate reached the control maximum
-
competitive, because excess substrate outcompeted it for the active site
-
irreversible, because the rate was depressed at low substrate concentration
-
an allosteric activator, because the treated rate rose as substrate was added
Practice question 2
An enzyme reaches half of its maximum velocity at a substrate concentration of 2 mM; a second enzyme acting on the same substrate reaches half maximum at 20 mM. It follows that
-
the first enzyme has a higher \(V_{\max}\) than the second
-
the second enzyme has the higher apparent affinity for the substrate
-
the first enzyme has the lower \(K_m\) and reaches half-maximal rate at lower substrate concentration
-
the two enzymes must have identical active sites
Practice question 3
An enzyme assayed at pH 2 shows no activity. When the solution is returned to pH 7, activity does not return. The most likely explanation is that
-
the low pH permanently removed the enzyme’s substrate from solution
-
the low pH raised the activation energy of the reaction and it stayed high
-
protonation disrupted the interactions holding the active site, and the unfolded protein did not refold
-
hydrogen ions competitively inhibited the active site and remained bound after neutralization
Practice answer key
1. B; 2. C; 3. C.
Practice answer explanations
-
Enzyme kinetics and inhibition, Question 1. Choice B is correct. Convergence on the same \(V_{\max}\) at saturating substrate is the signature of competition for the active site, because excess substrate outnumbers the inhibitor there. Choice A names the label but the wrong test, since a pure noncompetitive inhibitor lowers the plateau and can never reach the control maximum. Choice C reads ordinary competitive inhibition as irreversible, but the low-substrate decrease alone does not identify reversibility; loss of active enzyme would also lower the plateau. Choice D calls the compound an activator on the strength of a rise that every enzyme shows as substrate is added, treated or not.
-
Enzyme kinetics and inhibition, Question 2. Choice C is correct. \(K_m\) is the substrate concentration giving half of \(V_{\max}\), so 2 mM versus 20 mM means the first enzyme reaches half speed with one tenth the substrate without requiring a higher maximum rate. A lower \(K_m\) is often described as higher apparent affinity in this simple model, but it is not a direct binding constant. Choice A confuses \(K_m\) with \(V_{\max}\), which the data do not report. Choice B inverts the relationship. Choice D asserts identical active sites, which the measurements do not establish.
-
Enzyme kinetics and inhibition, Question 3. Choice C is correct. Extreme acid protonates side chains, breaks the ionic interactions holding the fold, and unfolds the active site; failure to recover is consistent with lasting denaturation, although activity data alone do not directly measure structure. Choice A confuses damage to the enzyme with removal of substrate. Choice B misplaces the effect, since a permanent barrier increase after the original conditions are restored is not established. PH can affect the enzyme’s catalytic state while present. Choice D does not follow from neutralization: restoring pH does not by itself demonstrate that a separate inhibitor concentration has fallen. Among the choices, C best fits persistent loss of activity; structural measurements would be needed to establish unfolding directly.
Continue your review at the AP Biology study hub.
Sources for further study
Review OpenStax’s explanation of enzymes and regulation. For the distinction between binding-site location and kinetic models, see the Assay Guidance Manual’s enzyme mechanism assays.

Related to This Article
More math articles
- Complementary and Supplementary Angles: Definitions and Examples for 2026
- The short-run supply curve is marginal cost above AVC
- Ideological groups
- 10 Most Common 6th Grade SBAC Math Questions
- The Best Grade 6 ELA Practice Tests for Tennessee Students
- Grade 3 Math: Division Facts
- Free Printable Grade 5 Math for Nebraska NSCAS Students: 49 Single-Skill PDF Worksheets
- 10 Most Common 4th Grade NYSE Math Questions
- Fifth-Grade Math in Texas (STAAR): 49 Free Printable Worksheets, One Concept Per Page
- Theories and Levels of Analysis







What people say about "Enzyme Kinetics: Km, Vmax and Inhibition"?
No one replied yet.