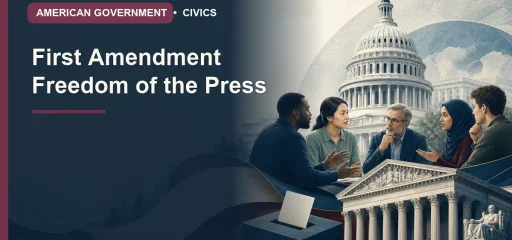
First Amendment Freedom of the Press
Freedom of the press protects the ability to investigate, publish, and distribute news, criticism, and opinion without government censorship or retaliation for viewpoint. The protection supports public oversight: citizens often learn what officials have done through reporters, editors, documentary makers, and independent publishers. It is not confined to owners of traditional printing presses. An individual […]
The Second Amendment and the Right to Bear Arms
The Second Amendment protects an individual right to keep and bear arms. District of Columbia v. Heller recognized a right to possess a handgun for self-defense in the home, and McDonald v. Chicago applied that protection to state and local governments through the Fourteenth Amendment. The right is not unlimited: a law may regulate arms […]