Use models as maps
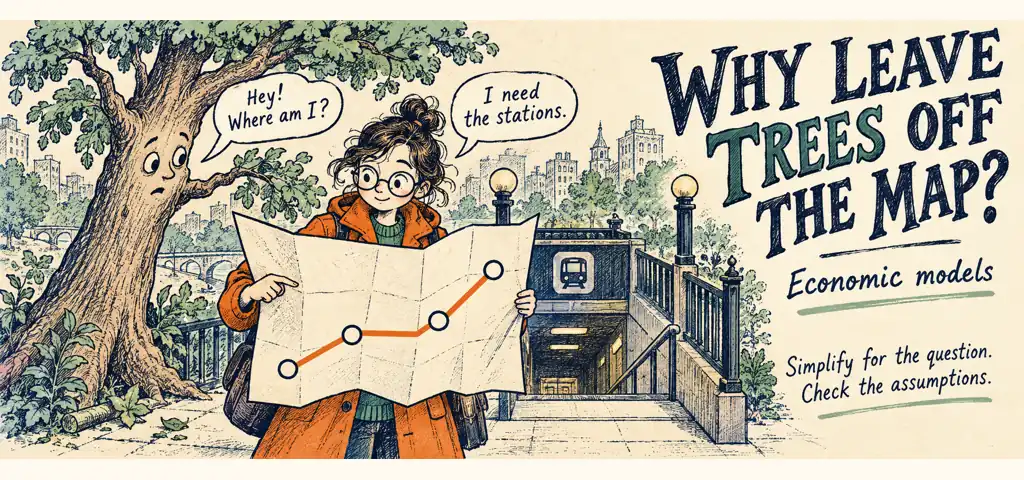
A subway map leaves out the trees along your route. Showing stations and connections without those details helps you plan the trip, much as an economic model leaves out details to isolate a particular relationship. Both are selective.
A demand curve connects a product's price with the quantity buyers would purchase under specified conditions, leaving out much of what makes each buyer's life different. Ask whether those simplifications suit your question.
Hold other influences still
Imagine a café raises the price of coffee from $3 to $4. To examine the price effect alone, hold buyers' incomes, tastes, and the prices of alternatives constant while comparing the quantities people would buy at the two prices. This is ceteris paribus. The phrase means other relevant things held constant.
With those conditions fixed, the basic demand model predicts a lower quantity demanded at the higher price, represented by a movement along the same demand curve. A new office next door changes another condition. Additional customers may shift demand while the price rises, allowing total coffee sales to increase even though the higher price discourages purchases compared with an unchanged price. Two effects overlap.
Rising sales alone cannot establish a causal price effect. The model helps separate the price comparison from the effect of the new office's customers.
State what the model is for
A café owner planning tomorrow's staffing may need weather forecasts, bookings, and nearby events. A student learning the price-quantity relationship can initially hold those influences constant because the question concerns the effect of price rather than tomorrow's total sales. The required detail differs.
For a hiring decision, knowing how another worker affects output may matter, while the color of the walls probably does little to explain the best staffing level. Keep details that help answer the question.
Graphs and equations can make a relationship precise. A verbal explanation also counts as a simple model when it identifies the choices people face, their constraints, and the responses the explanation predicts. Mathematics is useful when it clarifies those connections.
Know when to change the model
Suppose a model assumes many small sellers offering identical goods. Applying its conclusions to the only supplier in a remote town requires checking that assumption, because a firm that can influence price faces a different revenue relationship. Market power changes the calculation.
The time horizon matters too. An apartment market cannot produce hundreds of buildings overnight, so a prediction about supply over several years may tell you little about next month's adjustment.
Try a three-sentence model check. Explain the mechanism, name an assumption supporting it, and identify a specific change that could alter the result without assuming the original relationship has disappeared. For coffee, a new substitute drink could shift demand at an unchanged coffee price.
Watch the idea in action
A related lesson from Khan Academy. Read the examples above alongside the video.
Open the video on YouTube · Educator lesson and source

Reza is an experienced Math instructor and a test-prep expert who has been tutoring students since 2008. He has helped many students raise their standardized test scores--and attend the colleges of their dreams. He works with students individually and in group settings, he tutors both live and online Math courses and the Math portion of standardized tests. He provides an individualized custom learning plan and the personalized attention that makes a difference in how students view math.
Related to This Article
More math articles
- Neighborhood of a Point: Definition, Examples and Limits
- Area Models Unveiled: How to Divide Unit Fractions by Whole Numbers
- Civic duty
- CLEP College Math Practice Test Questions
- How to Complete the Square: Step-by-Step Guide With Examples for 2026
- Decolonization, Iran, Guatemala, and Covert Containment
- Maine Through Year Assessment Grade 8 Math Free Worksheets: Printable Grade 8 Math Practice for Every Skill
- The Best Grade 7 Math Book for Hawaii Students
- Your Quick Guide to the Best Tablets for Teachers
- Completing the Square Calculator — Vertex Form (Free)





















What people say about "Use Economic Models as Maps"?
No one replied yet.