Fitting a Line to Data: Complete Guide with Video and Examples
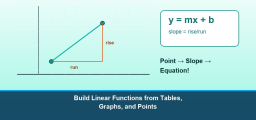
Once you spot a linear pattern in your scatter plot, the next step is to draw a line of best fit (also called a trend line) to capture that pattern. Think of it like this: you are finding the single best line that represents the overall trend, even though not every point sits exactly on it. A good line of best fit passes through the middle of your data cloud, with roughly equal numbers of points above and below. Once you have that line, you can write its equation (\(y=mx+b\)) and use it to make predictions about the future. Let’s see how!
Understanding fitting a line to data becomes much easier when you reduce each problem to a repeatable checklist. Start by identifying the important relationship in the problem, then use it consistently: Line of best fit: a line drawn so that roughly half the points lie above it and half below. It does not need to pass through any actual data point; Slope of the line: represents the average rate of change of \(y\) per unit increase in \(x\).
This topic matters because it connects basic skills to more advanced algebra, geometry, statistics, or modeling. When students can explain why a method works instead of memorizing isolated steps, they solve unfamiliar problems with much more confidence.
Watch the Video Lesson
If you want a quick visual walkthrough before practicing on your own, start with this lesson.
Understanding Fitting a Line to Data
Once you spot a linear pattern in your scatter plot, the next step is to draw a line of best fit (also called a trend line) to capture that pattern. Think of it like this: you are finding the single best line that represents the overall trend, even though not every point sits exactly on it. A good line of best fit passes through the middle of your data cloud, with roughly equal numbers of points above and below. Once you have that line, you can write its equation (\(y=mx+b\)) and use it to make predictions about the future. Let’s see how!
A strong approach to fitting a line to data is to slow down just enough to label the important quantities, recognize the governing rule, and check whether the final answer makes sense. That habit keeps small arithmetic mistakes from turning into bigger conceptual mistakes.
Students usually improve fastest when they practice explaining each step aloud. If you can say what the rule means, why it applies, and how the answer should behave, then fitting a line to data becomes much more manageable on classwork, homework, and tests.
Key Ideas to Remember
- Line of best fit: a line drawn so that roughly half the points lie above it and half below. It does not need to pass through any actual data point.
- Slope of the line: represents the average rate of change of \(y\) per unit increase in \(x\).
- Interpolation: predicting \(y\) for an \(x\)-value inside the range of the data (reliable). Extrapolation: predicting \(y\) for an \(x\)-value outside the data range (less reliable).}
Worked Examples
Example 1
Problem: A trend line passes through \((2, 30)\) and \((8, 60)\). Write the equation of the line.
Solution: Slope: \(m=\dfrac{60-30}{8-2}=\dfrac{30}{6}=5\).
Using point \((2,30)\): \(30=5(2)+b\Rightarrow b=20\).
Equation: \(y=5x+20\).
Answer: \(y=5x+20\)

Example 2
Problem: Using the equation \(y=5x+20\) above, where \(x\) = weeks of training and \(y\) = push-ups completed, data was collected for \(x \in [1,10]\).
(a) Predict push-ups at \(x=6\) weeks.
(b) Predict push-ups at \(x=20\) weeks. Is this reliable?
Solution: (a) \(y=5(6)+20=50\) push-ups. This is interpolation (\(x=6\) is within the data range) — reliable.
(b) \(y=5(20)+20=120\) push-ups. This is extrapolation (\(x=20\) is far outside the range of \(1\)–\(10\)) — less reliable; real performance may plateau.
Answer: (a) 50; (b) 120 (extrapolation — less reliable)
Example 3
Problem: A line of best fit is \(y = 4x + 12\). Predict the value of \(y\) when \(x = 9\), and explain what the slope means.
Solution: Substitute \(x = 9\): \(y = 4(9) + 12 = 48\). The slope is 4, which means the predicted \(y\)-value increases by 4 units for every increase of 1 unit in \(x\).
Answer: \(y = 48\); the slope means 4 units of growth per 1 unit of \(x\)
Common Mistakes
- Picking two original data points instead of two clean points on the trend line.
- Assuming a line of best fit must pass through every point.
- Using extrapolation far outside the data range as if it were fully reliable.
Practice Problems
Try these on your own before checking a textbook or notes. The goal is to explain the method, not just state a final answer.
- Trend line passes through (0,4) and (5,19).\;Slope=
- Trend line passes through (0,4) and (5,19).\;y-intercept=
- Trend line through (1,8) and (4,17).\;Equation=
- Trend line through (2,10) and (6,26).\;Equation=
- Line y=3x+5.\;Predict y when x=7.
- Line y=3x+5.\;Predict y when x=0.
Study Tips
- The line of best fit does not have to pass through any particular data point. Choose two points that lie on the line (not necessarily in the data set) to compute the slope.
- A positive slope on the trend line signals a positive association; a negative slope signals a negative association.
- Always state the units for slope: e.g.\ “5 push-ups per week of training” is far more informative than just “5.”
Final Takeaway
Fitting a Line to Data is easier when you focus on the structure of the problem instead of chasing isolated tricks. Use the core rule, keep your work organized, and make one quick reasonableness check before you finish.
Once that process becomes automatic, you can move through more challenging questions with much more speed and accuracy. Rework the examples above, solve the practice set, and then come back to fitting a line to data again after a day or two to make the skill stick.

Related to This Article
More math articles
- How to Graph a Horizontal or Vertical line?
- The Ultimate ISEE Lower-Level Math Course (+FREE Worksheets & Tests)
- The Best Grade 8 Math Book for Florida Students
- 8th Grade FSA Math Worksheets: FREE & Printable
- Best tools for Online teachers
- How Social Studies Tests Work: Sources, Reasoning, and What They Measure
- 5th Grade CMAS Math Worksheets: FREE & Printable
- FREE 6th Grade PSSA Math Practice Test
- How to Find Vague Limits by Change of Function’s Value
- A Comprehensive Guide to the Properties of Rhombuses


What people say about "Fitting a Line to Data: Complete Guide with Video and Examples - Effortless Math"?
No one replied yet.