How to Sketch and Describe Function Graphs? (+FREE Worksheet!)
A graph does more than show a line or a curve—it tells a story. By learning how to sketch a function from a description and describe a function from its graph, you gain a powerful ability to translate between visual and verbal representations of real-world situations.
In 8th-grade math, you are expected to identify key features—intercepts, intervals of increase and decrease, maximums and minimums—and to create or interpret “story graphs” that model everyday scenarios. This guide breaks it all down with clear steps, examples, and practice.
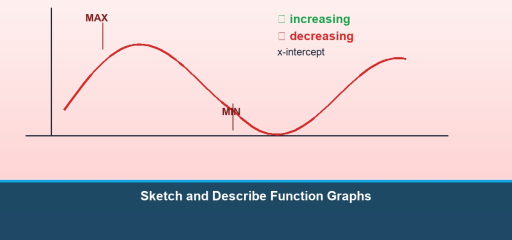
Key Features of a Function Graph
- Intercepts: Where the graph crosses the axes. The y-intercept is the point \((0, b)\); the x-intercept(s) are points where \(y = 0\).
- Increasing interval: A section where the graph goes up as you move from left to right. Formally, \(f(x_{1}) < f(x_{2})\) whenever \(x_{1} < x_{2}\).
- Decreasing interval: A section where the graph goes down as you move left to right.
- Constant interval: A flat, horizontal section—the function’s value does not change.
- Maximum: The highest point on the graph (or on an interval).
- Minimum: The lowest point on the graph (or on an interval).
- Domain: All possible \(x\)-values (inputs).
- Range: All possible \(y\)-values (outputs).
How to Describe a Function from Its Graph
- State the intercepts. Note where the curve crosses the \(x\)-axis and \(y\)-axis.
- Identify intervals of increase, decrease, and constancy. Use inequalities or interval notation (e.g., “increasing on \(0 \le x \le 3\)”).
- Locate any maximum or minimum values and the \(x\)-values where they occur.
- State the domain and range.
- Describe the end behavior—what happens as \(x\) gets very large or very small?
How to Sketch a Function from a Description
- Set up your axes. Label the horizontal axis (independent variable) and vertical axis (dependent variable) with appropriate scales.
- Plot known points—intercepts and any given coordinates.
- Draw increasing, decreasing, or constant segments in the correct intervals.
- Place maximums and minimums at the specified locations.
- Connect the segments smoothly (or with corners if the description calls for it).
Worked Examples
Example 1 — Describing a Graph
A graph starts at \((0, 2)\), rises to \((3, 8)\), is constant from \((3, 8)\) to \((5, 8)\), then falls to \((8, 0)\).
- y-intercept: \((0, 2)\). x-intercept: \((8, 0)\).
- Increasing: \(0 \le x \le 3\).
- Constant: \(3 \le x \le 5\).
- Decreasing: \(5 \le x \le 8\).
- Maximum: \(y = 8\) on the interval \(3 \le x \le 5\).
- Minimum: \(y = 0\) at \(x = 8\) (also \(y = 2\) at start, but the absolute minimum is 0).
Example 2 — Story Graph (Distance vs. Time)
Scenario: Marcus walks from home to the library (increasing distance), reads for an hour (constant distance), then walks back home (decreasing distance).
Sketch description:
- Start at the origin \((0, 0)\): at home, zero distance.
- Segment 1 (0 to 15 min): Line rises from 0 to 1 mile (walking to library).
- Segment 2 (15 to 75 min): Horizontal line at 1 mile (reading at library).
- Segment 3 (75 to 90 min): Line falls from 1 mile back to 0 (walking home).
Example 3 — Temperature Over a Day
A city’s temperature starts at \(60°F\) at 6 AM, rises to \(85°F\) at 2 PM, then drops to \(65°F\) at 10 PM.
- Increasing: 6 AM to 2 PM (8 hours).
- Decreasing: 2 PM to 10 PM (8 hours).
- Maximum: \(85°F\) at 2 PM.
- Minimum: \(60°F\) at 6 AM (within the domain given).
- y-intercept (at 6 AM): \(60°F\).
Example 4 — Roller Coaster Height
A roller coaster climbs from ground level to 120 ft in 10 seconds, drops steeply to 30 ft by 15 seconds, climbs again to 80 ft by 20 seconds, and finally descends to 0 ft at 30 seconds.
- Increasing: \(0 \le t \le 10\) and \(15 \le t \le 20\).
- Decreasing: \(10 \le t \le 15\) and \(20 \le t \le 30\).
- Maximum: 120 ft at \(t = 10\).
- Local minimum: 30 ft at \(t = 15\).
Video Lesson
Watch this video for additional examples and a step-by-step walkthrough:
Understanding Story Graphs
A story graph (or qualitative graph) represents a real-life situation without exact numbers. The key is understanding what each axis represents and what the shape means:
- Rising section: The quantity on the y-axis is increasing over time.
- Flat section: No change—the person stopped, the temperature held steady, etc.
- Falling section: The quantity is decreasing.
- Steep slope: Rapid change.
- Gentle slope: Slow change.
When matching a story to a graph (or vice versa), focus on the order of events and whether each segment should rise, fall, or stay flat.
Practice Problems
- A graph starts at \((0, 5)\), decreases to \((4, 1)\), then increases to \((7, 6)\). State the intervals of increase and decrease, and the minimum value.
- Sketch a distance-time graph: A jogger runs 3 miles in 30 minutes, rests for 10 minutes, then runs back home in 20 minutes.
- A graph has x-intercepts at \((-2, 0)\) and \((4, 0)\), a y-intercept at \((0, 8)\), and a maximum at \((1, 9)\). Is this graph linear or nonlinear? Describe its behavior.
- Describe a real-world situation that could produce a graph that increases, stays constant, then decreases.
- A function is increasing on \((-\infty, 2)\) and decreasing on \((2, \infty)\). What is at \(x = 2\)?
- Sketch a graph for: “Water fills a tank quickly at first, then more slowly, until the tank is full.”
- A graph of speed vs. time shows: constant speed for 5 sec, then speed increases for 3 sec, then constant again. Describe the motion.
- Given intercepts \((0, 0)\) and \((6, 0)\) with a minimum at \((3, -9)\), sketch and identify the function type.
Solutions
- Decreasing: \(0 \le x \le 4\). Increasing: \(4 \le x \le 7\). Minimum: \(y = 1\) at \(x = 4\).
- Graph starts at \((0, 0)\), rises to \((30, 3)\), stays flat at \((40, 3)\), then falls to \((60, 0)\).
- Nonlinear (a linear function can have at most one x-intercept unless it is the x-axis itself). Increasing on \(-2 \le x \le 1\), decreasing on \(1 \le x \le 4\). Maximum \(y = 9\) at \(x = 1\). Likely a downward-opening parabola.
- Example: A hot-air balloon rises (increase), floats at a fixed altitude (constant), then descends (decrease).
- A maximum (the function switches from increasing to decreasing).
- Graph starts at origin, rises steeply at first (concave down), then flattens as it approaches a horizontal asymptote (the full level).
- The object moves at a steady pace, then accelerates for 3 seconds, then continues at the new (higher) constant speed.
- Downward parabola opening upward: \(y = (x)(x-6) = x^{2} – 6x\). Vertex at \((3, -9)\). This is a quadratic (U-shaped) function.
Common Mistakes to Avoid
- Confusing the y-axis variable with the x-axis variable. In a distance-time graph, a flat section means distance isn’t changing (the person stopped), not that time stopped.
- Mixing up “steep” and “fast.” A steeper section of a distance-time graph means faster speed, not necessarily more distance.
- Forgetting that graphs can have multiple increasing or decreasing sections. Real-world functions often alternate between rising and falling.
Frequently Asked Questions
What is a qualitative graph?
A qualitative graph shows the general shape and behavior of a relationship without exact numbers. It focuses on whether values increase, decrease, or stay constant.
How do I describe end behavior?
State what happens to \(y\) as \(x\) approaches positive or negative infinity. For example: “As \(x \to \infty\), \(y \to \infty\)” for a line with a positive slope.

Related to This Article
More math articles
- The Best Algebra 1 Book for Alaska Students
- PSAT Math Practice Test Questions
- Writing Linear Equations Practice — Slope-Intercept Form (Free)
- Grade 2 English Practice for Kansas Second Graders
- Number Properties Puzzle – Challenge 3
- Grade 3 Math: Word Problems: Addition and Subtraction
- How to Find the Volume of a Cylinder, Cone, and Sphere
- Free Grade 4 English Worksheets for Washington Students
- The 5 Best Computers For College Students
- Other Punctuation Marks


What people say about "How to Sketch and Describe Function Graphs? (+FREE Worksheet!) - Effortless Math"?
No one replied yet.