Trends and Predictions From Data
Reading a single value off a graph is a good start, but the science test usually wants more: it wants you to see where the data is heading. The overall direction of the data is called a trend, and once you can spot a trend, you can make a reasonable prediction about what comes next. This is one of the most useful data skills on the whole test.
This lesson shows you how to describe a trend and how to use it to predict — carefully.
What a Trend Looks Like
A trend is the general pattern in the data, ignoring the small bumps. Data can trend up (values generally rising), trend down (generally falling), or stay level (no clear change). On a scatterplot, you can picture a straight trend line that follows the middle of the dots. The direction of that line is the trend.
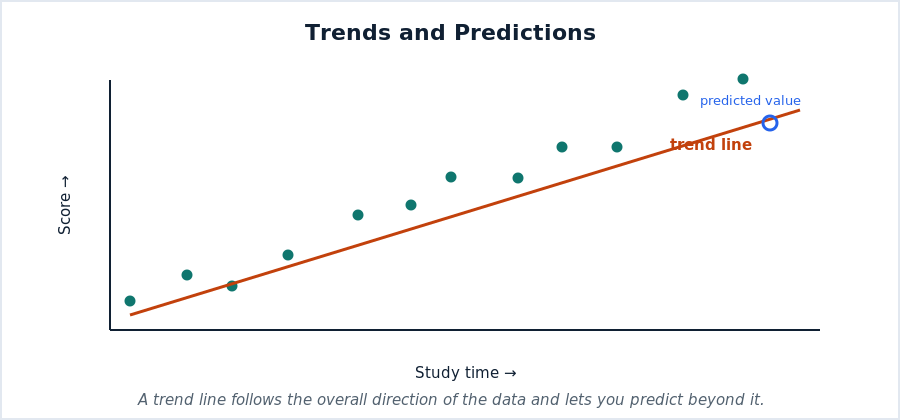
In the graph above, more study time generally goes with higher scores, so the trend line rises. Notice that not every dot sits exactly on the line — that is normal. The trend is about the overall direction, not any single point.
Making a Prediction
Once you have a trend, you can extend it to predict a value you did not measure. If scores rise steadily with study time, you can estimate the score for a study time just beyond your data by continuing the trend line. That is exactly what the circled point in the graph represents — a predicted value that follows the established pattern.
Predictions are estimates, not guarantees. The further you push beyond the data you actually have, the less certain the prediction becomes. Predicting a little past the last point is reasonable; predicting far beyond it is risky, because the trend might not continue.
Don’t Get Fooled by a Single Bump
A common trap is to focus on one unusual point instead of the overall direction. If a mostly rising line has one dip, the trend is still upward — that dip is just noise. When a question asks for the trend, describe the big picture, not the exception. And when a question asks for the biggest change, that is different: then you look for the steepest part.
Watch: A Short Video Lesson
Mrs.D Math walks through this skill clearly in a few minutes. It is a helpful companion to the reading above:
A Routine for Trend Questions
- Step back and describe the overall direction: up, down, or level.
- Ignore small bumps; the trend is the general pattern.
- To predict, continue the trend just past the data — and treat it as an estimate.
- Be cautious about predicting far beyond the data you actually have.
Practice
- What is a trend?
- If a line graph of sales rises most months but dips once, what is the overall trend?
- What does a trend line on a scatterplot show?
- Why is predicting far beyond the data risky?
- A scatterplot of study time vs. score trends upward. What can you predict about more study time?
- Should you describe a trend using one unusual point or the overall pattern?
Answers
- The general direction or pattern of the data.
- Upward (rising), since one dip does not change the overall pattern.
- The overall direction of the relationship between the two quantities.
- The trend may not continue, so the estimate becomes less reliable.
- More study time is likely to go with a higher score.
- The overall pattern.
Where This Fits in Your Science Prep
Trends bring together everything in this group: tables, bar and line graphs, and circle graphs and scatterplots. Just remember that a trend is a link, which connects back to correlation versus causation. See all topics on the Science Topics Hub.

Related to This Article
More math articles
- How Verification Became the Most Controversial Topic in Online Entertainment
- The Best TABE Math Worksheets: FREE & Printable
- The Best Grade 8 ELA Practice Tests for Oklahoma Students
- 5 Algebra 1 Books: Choose the Right Study Guide
- Reading and Interpreting Line Plots for 4th Grade
- Words for Change and Stability
- Using Context Clues
- Evidence for Evolution
- Best Office Chairs for Online Math Teachers
- Introduction to Sequences and Series: Fundamentals, Types, and Applications










What people say about "Trends and Predictions From Data"?
No one replied yet.