Reading Scientific Data Tables
Tables are the most common way science presents numbers, and the test leans on them heavily. The reassuring part is that a table is just an organized grid: once you know how to find where a row and a column meet, you can pull any value out of it in seconds. No memorized science needed — only careful reading.
This lesson shows you how a data table is organized and how to read a single value, compare values, and spot a pattern without getting lost.
How a Table Is Organized
Every data table has column headings across the top that name what is being measured, and rows that each hold one observation. To find a value, you pick a row and follow it across to the column you want. Where they meet is your number.
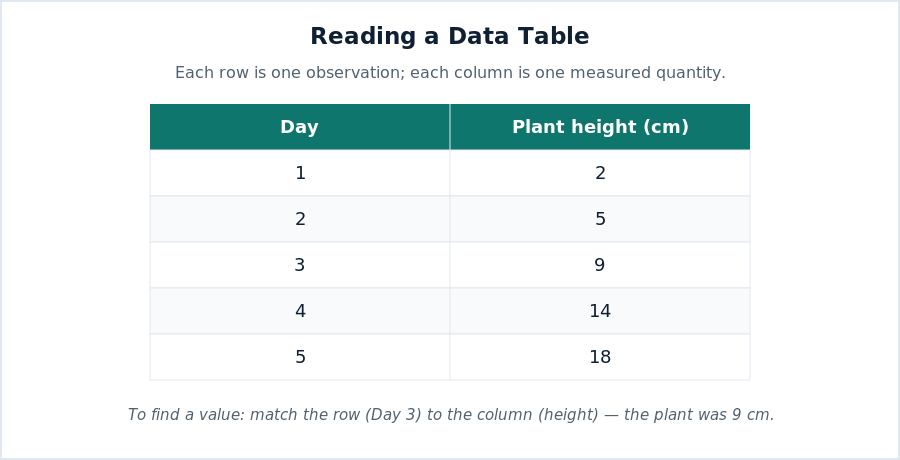
Try it with the table above. To find the plant’s height on Day 3, find the row for Day 3 and read across to the height column: 9 cm. That is the entire skill of reading a single value — row meets column.
Always Read the Units
A number without units can trick you. The height column is measured in centimeters, so “9” means 9 cm, not 9 meters or 9 inches. Column headings usually tell you the units, often in parentheses. On the test, a wrong answer is sometimes the right number with the wrong units, so make a habit of reading the heading, not just the number.
Comparing Values and Spotting Patterns
Once you can read one value, comparisons are easy: read two values and see which is larger. In the plant table, the height goes 2, 5, 9, 14, 18. Each day the plant is taller, and the jumps are getting bigger — that is a pattern of growth that is speeding up. Noticing a pattern like this often answers questions such as “What will happen next?” or “Between which days did the plant grow the most?”
A quick way to find the biggest change is to look at the differences between rows: from Day 2 to Day 3 the plant grew 4 cm; from Day 4 to Day 5 it grew 4 cm as well. Reading differences, not just values, is how you turn a table into a story.
Watch: A Short Video Lesson
adventures in ISTEM walks through this skill clearly in a few minutes. It is a helpful companion to the reading above:
A Routine for Table Questions
- Read the column headings so you know what each number measures — and its units.
- To find a value, pick the row, follow it across to the right column.
- To compare, read two values and see which is larger.
- To spot a pattern, look at how the numbers change from row to row.
Practice
Use the plant-height table shown above (Day 1: 2 cm, Day 2: 5 cm, Day 3: 9 cm, Day 4: 14 cm, Day 5: 18 cm).
- How tall was the plant on Day 4?
- What are the units of the height column?
- Between which two days did the plant grow the most?
- Was the plant taller on Day 2 or Day 5?
- Describe the overall pattern in one sentence.
- Where do you look to find what each number measures?
Answers
- 14 cm.
- Centimeters (cm).
- Between Day 3 and Day 4 (a jump of 5 cm).
- Day 5.
- The plant grew taller every day, and the growth generally increased.
- The column heading.
Where This Fits in Your Science Prep
Tables are the starting point for reading data. Next, learn to read the same information as pictures in bar graphs and line graphs and circle graphs and scatterplots, then use them to spot trends and predictions. See all topics on the Science Topics Hub.

Related to This Article
More math articles
- Improper integrals: Everything A Beginner Needs to Know
- The Best Algebra 1 Book for Illinois Students
- Majority Rule and Minority Rights
- What Skills Do I Need for the CHSPE Math Test?
- Collective Behavior, Social Movements, and Social Change
- The Ultimate CLEP College Algebra Formula Cheat Sheet
- Grade 3 Vocabulary and Fluency: Build Word Power Without the Stress
- 5th Grade ACT Aspire Math FREE Sample Practice Questions
- Top 10 HiSET Math Practice Questions
- Free Colorado Grade 2 Math Worksheets






















What people say about "Reading Scientific Data Tables"?
No one replied yet.