Bar Graphs and Line Graphs in Science
In science, a bar graph compares separate categories, such as the number of species in different habitats, while a line graph shows how one variable changes with another continuous variable, usually time or temperature. Read the axis labels and units first, then look for the trend before answering any question.
Graphs turn a wall of numbers into a picture you can read at a glance — if you know what kind of picture you are looking at. The two you will meet most on the science test are the bar graph and the line graph. They look different because they do different jobs, and knowing which is which tells you what kind of question to expect.
This lesson shows you how to read both, and when each one is the right tool.
Two Graphs, Two Jobs
A bar graph compares separate categories. Each bar stands for a group, and the taller the bar, the larger the value. A line graph shows how one thing changes over time. Points are connected in order, so a rising line means something is increasing and a falling line means it is decreasing.
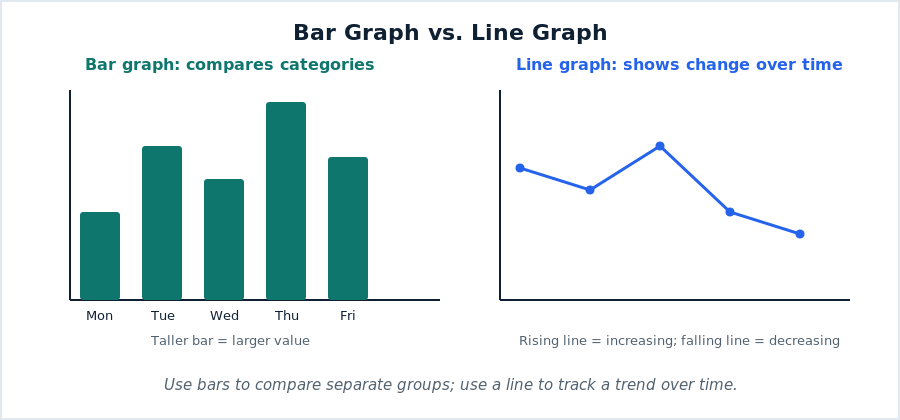
The shape tells you the job. If you see separate bars, the question is probably about comparing groups (“Which day had the most?”). If you see a connected line, the question is probably about change (“When did it rise fastest?”).
Read the Axes First
Before reading any value, check the two axes. The horizontal axis (the bottom) usually shows the categories or the time, and the vertical axis (the side) shows the amount. Notice the scale — does each gridline mean 1, 5, 10, or 100? Misreading the scale is the most common graph mistake. Once you know the scale, reading a bar’s height or a point’s position is simple.
Getting Answers Off a Graph
To read a bar graph value, find the top of the bar and trace across to the vertical axis. To read a line graph value, find the point above the time you care about and trace across to the side. To find the biggest change on a line graph, look for the steepest section — the steeper the line, the faster the change. A flat section means no change at all.
These moves cover most graph questions: read a single value, compare two values, or describe how a value changed.
Watch: A Short Video Lesson
QueenofChibiLand walks through this skill clearly in a few minutes. It is a helpful companion to the reading above:
A Routine for Graph Questions
- Identify the graph type: bars (compare groups) or line (change over time).
- Read both axis labels and the scale before reading values.
- To read a value, trace from the bar top or point across to the amount axis.
- On a line graph, steep means fast change; flat means no change.
Practice
- Which graph is better for comparing rainfall in five different cities?
- Which graph is better for showing a city’s temperature across one week?
- On a line graph, what does a steep upward section mean?
- On a bar graph, what does a taller bar mean?
- What is the most common mistake when reading a graph’s values?
- What does a flat line on a line graph tell you?
Answers
- A bar graph — it compares separate categories.
- A line graph — it shows change over time.
- The value is increasing quickly.
- A larger value for that category.
- Misreading the scale on the axis.
- The value is not changing during that time.
Where This Fits in Your Science Prep
Bar and line graphs build on reading data tables. Next, add two more graph types in circle graphs and scatterplots, then learn to read the direction of the data in trends and predictions. See all topics on the Science Topics Hub.

Related to This Article
More math articles
- Top 10 Tips You MUST Know to Retake the CLEP College Algebra
- Mead’s Role Taking and Social Self
- Who is the Greatest Mathematician of all time?
- Temperature, Humidity, and Airflow
- ParaPro Math Formulas
- What Skills Do I Need for the ALEKS Math Test?
- HiSET Math Flashcards (Free Online: Formulas, Terms & Concepts)
- North Dakota Algebra 1 Free Worksheets: Free Printable Algebra 1 PDFs, No Signup
- Progressive Jackpot Math: When the Number Gets Big Enough to Matter
- The Ultimate PSAT 8/9 Math Formula Cheat Sheet


















What people say about "Bar Graphs vs Line Graphs in Science: When to Use Each"?
No one replied yet.