A 96% RTP Slot Over a Million Spins: The Distribution, Not the Average
The number 96% gets quoted on every slot review and game info screen, but it hides more than it tells. A 96% RTP is the long-run mean of a probability distribution, not a guarantee about your next session, your next thousand spins, or even your next hundred thousand. The slot rtp distribution is wide, lumpy, and tail-heavy, and once you actually plot what a million spins looks like, the headline percentage stops feeling like a refund and starts feeling like a center of gravity that very few sessions ever land on.
RTP is an average pulled from a noisy distribution
Return to player is calculated as the expected value of the prize divided by the stake, summed across every possible outcome weighted by probability. A 96% RTP means that if you sampled the outcome random variable an infinite number of times, the average payout per dollar wagered would approach 96 cents. It says nothing about variance, nothing about the shape of the tail, and nothing about what any finite stretch of play will look like.
Two slots can share the same 96% RTP and behave like completely different games. One might pay frequent small wins and rarely produce a result more than ten times your bet. Another might give you long dry stretches punctuated by a 5,000x bonus round. Same mean, wildly different distributions, wildly different player experiences.
What 1,000,000 spins actually looks like
Take a steady player at $1 per spin who manages to grind out a full million spins. Total wagered is $1,000,000. Expected return is 96% of that, or $960,000. Expected net loss is $40,000.

That figure is the center of a bell-shaped cloud of possibilities, not a prediction. Some million-spin runs will end down $60,000. Others will end down $20,000. A small fraction will end up ahead, driven almost entirely by whether a big bonus or jackpot hit during the run. The mean is real, but the spread around it is the part that decides how any specific player remembers the game.
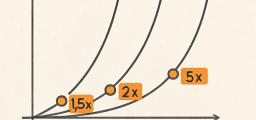
Standard deviation per spin: where the volatility lives
Per-spin standard deviation on a typical real-money slot lands somewhere between roughly 3 and 15 times the bet, depending on game design. A low-volatility game might sit near 3x. A medium-volatility game sits around 5x. A high-volatility game with rare massive bonuses can run 10x or more.
Take a medium-vol slot at $1 per spin with a per-spin standard deviation of about 5. After N independent spins, the standard deviation of total return scales as 5 × sqrt(N), because variances add for independent draws and the square root falls out when you go back to standard deviation.
- 1,000 spins: total std dev ≈ 5 × sqrt(1,000) ≈ 158
- 10,000 spins: total std dev ≈ 5 × sqrt(10,000) = 500
- 100,000 spins: total std dev ≈ 5 × sqrt(100,000) ≈ 1,581
- 1,000,000 spins: total std dev ≈ 5 × sqrt(1,000,000) = 5,000
Notice the cruel arithmetic. The expected loss grows linearly in N, but the standard deviation grows only with sqrt(N). The longer you play, the more the noise gets dwarfed by the drift toward the house edge.
Why expected loss grows faster than uncertainty
This is the single most important fact about slot play and the one that gets buried under marketing language. Expected loss per spin is fixed at 4% of the wager for a 96% RTP game. Over N spins of $1, expected loss is $0.04 × N. That is linear in N.
Standard deviation of total return, in contrast, scales as σ × sqrt(N), where σ is the per-spin standard deviation. That is sublinear. The ratio of standard deviation to expected loss is therefore proportional to sqrt(N)/N = 1/sqrt(N), which shrinks toward zero as N grows.
Translated to play time: the longer you sit at the machine, the more the random fluctuations get squeezed against the steady drift of the house edge. After a thousand spins you might be ahead. After a hundred thousand you almost certainly will not be. After a million you cannot be, except by truly extreme tail events that essentially never occur in real play.
The central limit theorem and the bell curve of sessions
Each spin has its own ugly, spiky distribution: most outcomes are zero, some are small multiples of the bet, a few are big multiples, and a tiny number are jackpot-sized. That single-spin distribution looks nothing like a bell curve.
The central limit theorem says that once you sum or average enough independent spins, the distribution of the total starts to look approximately normal, regardless of how weird each individual spin looks. For session-sized samples, this is genuinely useful. Total return after a few thousand spins is well approximated by a normal distribution centered at 0.96 × wagered, with a standard deviation set by the per-spin volatility and sqrt(N).
The approximation is least trustworthy in the extreme right tail, where rare massive payouts live, because those events are too rare to be smoothed by the CLT at modest sample sizes. The body of the curve, though, is a reasonable picture of what most players will experience.
95% confidence intervals at 1,000, 10,000, and 100,000 spins
A 95% confidence interval for total return is roughly the mean plus or minus 1.96 standard deviations. Using the medium-vol assumption of 5 × bet per spin and $1 bets:
| Spins | Wagered | Expected return (96%) | Std dev of return | 95% CI for return | 95% CI for net |
|---|---|---|---|---|---|
| 1,000 | $1,000 | $960 | ≈ $158 | ≈ $650 to $1,270 | −$350 to +$270 |
| 10,000 | $10,000 | $9,600 | ≈ $500 | ≈ $8,620 to $10,580 | −$1,380 to +$580 |
| 100,000 | $100,000 | $96,000 | ≈ $1,581 | ≈ $92,901 to $99,099 | −$7,099 to −$901 |
| 1,000,000 | $1,000,000 | $960,000 | ≈ $5,000 | ≈ $950,200 to $969,800 | −$49,800 to −$30,200 |
Read the bottom row carefully. After a million spins, the 95% interval for net result is fully on the losing side. There is no realistic scenario, under medium volatility, where the player walks away ahead. The slot rtp distribution has tightened so much that the only question is how far below break-even the result lands.
The top row tells the opposite story. Over 1,000 spins, the 95% interval easily contains a winning session. That is not a strategy edge. That is just variance still being loud enough to overwhelm the small expected loss.
The jackpot lives in the right tail
The numbers above assume a tidy normal approximation. Real slots have a fatter right tail because of rare bonus rounds and progressive jackpots. A single 10,000x bet outcome on a $1 wager is a $10,000 swing, and even small per-spin probabilities for such events shift the distribution.
What this means in practice: the actual distribution of total return is slightly skewed. The bulk of players land near or below the mean, and a small number of players land well above it because they caught a tail event. The mean is preserved by accounting; for every lucky player up $20,000 on a session, there are many unlucky players whose losses subsidize that outcome. The casino does not “pay” anyone. The other players do.
For game math context, sites like Wizard of Odds publish hit frequencies and volatility breakdowns that show just how much of the RTP is concentrated in rare events.
A worked example: simulating one player’s million spins
Pretend you ran a clean simulation. A $1 bet, 96% RTP, per-spin standard deviation of $5, one million spins. Plot the running cumulative return against spin count. What you would see is a noisy line that drifts steadily downward, with occasional sharp upward spikes whenever a bonus round pays out, followed by long stretches of grind.
At 1,000 spins in, the line could easily be above zero. At 10,000 spins, it would usually sit somewhere in the −$200 to −$600 region, but the daily-life noise is still large enough that a bonus hit on spin 9,847 might pull it back near break-even. By 100,000 spins, the line is clearly negative, hovering near the expected loss of −$4,000 with a band of plus or minus a few thousand. By 1,000,000 spins, the line is essentially nailed to −$40,000, give or take a few percent.
Repeat the simulation a thousand times with different random seeds and overlay the curves. Early on, they fan out widely. Late, they collapse onto a single trajectory: the law of large numbers in motion. Variance never disappears, but it becomes tiny relative to the mean drift.
Why “I played 100 spins and got 78% back” is statistical noise
Short sessions are pure variance. With 100 spins at $1, total std dev is roughly 5 × sqrt(100) = 50, on $100 wagered. A 95% interval for the return is something like $96 ± $98, which covers anywhere from $0 back to almost double your stake. A 78% return on that sample is not evidence the slot is “tight.” It is a single draw from a distribution wide enough to make almost any short result plausible.
The same logic kills the opposite anecdote. Someone who hits 140% return over 200 spins did not “find a hot machine.” They sampled the same distribution and landed in the upper part of the body. Run it again and the result regresses toward the mean, slowly, with sqrt(N).
This is also why regulators care more about long-run measurement than session reports. Bodies like the UK Gambling Commission require operators to certify RTP over very large samples, precisely because shorter windows are dominated by variance and would tell you almost nothing about whether a game is paying as advertised.
What this means for how you read a 96% number
Treat the RTP figure as a description of a distribution, not a discount on your stake. A few practical reframings:
- 96% RTP is the mean of a probability distribution, not a refund schedule.
- Per-spin volatility, not RTP alone, decides how a session feels.
- Standard deviation of total return grows with sqrt(N); expected loss grows with N. Long play tightens the band around the mean loss.
- Confidence intervals widen for short sessions and narrow for long ones; “winning sessions” are normal noise, not signal.
- The right tail of the slot rtp distribution carries a meaningful share of the advertised return; most players never see it.
- Per-game published RTP is verified over millions of simulated or recorded spins, not over your evening on the device.
If you want to sharpen the underlying probability intuition, walking through the math of expected value and variance from scratch is worth more than any “slot strategy” article. Effortless Math has step-by-step lessons on standard deviation and the central limit theorem that make these calculations concrete.
FAQ
Does a 96% RTP mean I get $96 back for every $100 I bet?
No. It means that across an enormous number of spins, the average payout converges to 96 cents per dollar wagered. Any single $100 session can land far above or far below that average because variance dominates short samples.
How many spins until RTP “kicks in”?
There is no spin count where the math switches on. The mean is always there; what changes is how visible it is. At 1,000 spins it is buried under noise. At 1,000,000 spins it dominates. Somewhere in between, your realized return starts looking close to the published RTP.
Is a high-RTP slot safer than a low-RTP slot?
Lower expected loss per spin, yes. But two slots at 96% RTP can have very different volatilities, and the higher-volatility game can ruin a bankroll faster even with the same theoretical edge, because the swings are larger relative to your stake.
Why do regulators measure RTP over millions of spins?
Because the standard deviation of an RTP estimate scales like 1/sqrt(N). You need a very large N to push the estimation error well below a percentage point. Short audits would catch only the most extreme miscalibrations.
Can I beat a 96% RTP slot with a betting system?
No. Slot outcomes are independent draws from the same distribution, and no sequence of bet sizes changes the expected value of the underlying random variable. Progressive systems can compress losses into rare big losses, but the mean loss is unchanged.
Gambling outcomes are uncertain; no strategy guarantees profit.

Related to This Article
More math articles
- 5 Best CBEST Math Study Guides
- How to Find Constant of Proportionality?
- 6 Strategies to Make Your Math Test Preparation More Effective
- Verb Tenses, Forms, and Voice
- Files, Rasps, and Abrasives: Shape and Finish
- Differential Equations: Laws of The Universe Unraveled
- Best Tablet Floor Stands For Online Teaching
- Quality Benchmarks and Process Improvement
- Parallel and Perpendicular Lines for 4th Grade
- Classical Civilizations and Geography


What people say about "A 96% RTP Slot Over a Million Spins: The Distribution, Not the Average - Effortless Math"?
No one replied yet.