LEARN · PRACTICE · EXPLORE
Louisiana Grade 3 Math
Use a three-books-per-unit bar graph, compare one category with two combined categories, and follow current Louisiana Grade 3 mathematics references.
Focused lessons · Useful practice · Clear next steps
What do Louisiana 3rd graders learn in math?
In 3rd grade, Louisiana math centers on multiplication and division within 100, fractions on a number line, area and perimeter, and rounding. Students take the LEAP grade 3 math test in the spring. This page explains each Louisiana grade 3 math standard and pairs it with short lessons, skill quizzes, printable worksheets and a full-length practice test.
Printable Louisiana grade 3 math books:
- 6 Louisiana LEAP 2025 Grade 3 Math Practice Tests
- 5 Louisiana LEAP Grade 3 Math Practice Tests
- 6 Louisiana LEAP 2025 Grade 3 Math Practice Tests
- 7 Louisiana LEAP Grade 3 Math Practice Tests
- Louisiana LEAP 3rd Grade Math Workbook
- Louisiana LEAP Grade 3 Math Made Ridiculously Simple
- The Most Comprehensive Louisiana LEAP Grade 3 Math Preparation Bundle
Standards source: Louisiana Mathematics Standards, Louisiana Department of Education.
Start with Grade 3 Math Practice
Use this general Grade 3 math practice test to check your skills, then review the missed topics below. It is independent practice, not an official state assessment or a replica of its timing, scoring, or question types.
Open the Grade 3 practice test Explore Grade 3 lessons and worksheetsClassroom practice and state assessment information
Grade 3 is within Louisiana’s general LEAP mathematics testing range. The linked learning resources have their own directions and scoring; a practice score does not establish an official state performance level. Read the state assessment overview for official guidance.
Use the worked activity and lesson directory to choose a skill. Confirm the directions of an independent practice resource before assigning it.
Read a scaled bar graph before comparing categories
How many more books are in the two smaller categories together?
A fictional classroom shelf has eighteen fiction books, nine history books, and fifteen science books. The graph below uses a scale of three books per interval. Compare the combined history and science total with the fiction total. This original example asks for two connected calculations, rather than the difference between only two bars.
Use the scale in both calculations
The history bar reaches nine and the science bar reaches fifteen, so their combined total is 9 + 15 = 24 books. Fiction has eighteen books. The combined categories therefore have 24 − 18 = 6 more books than fiction. The answer should identify which quantities were compared: history and science together have six more than fiction. On the graph, history spans three intervals and science spans five. Their eight intervals represent twenty-four books, not eight books, because each interval stands for three.
Check the meaning of each step
Subtracting fifteen from eighteen gives three, but that compares fiction with science alone. Adding all three categories gives forty-two books, a total for the whole shelf. Neither calculation answers the stated question. Before calculating, circle the two categories to be combined and underline the category used for comparison. An explanation can connect the first step with a combined quantity and the second with how much that quantity exceeds another.
Avoid an unscaled drawing
Equal distances on the axis must represent equal increases. Labels of zero, three, six, nine, twelve, fifteen, and eighteen are equally spaced here. A bar for nine reaches halfway to eighteen because nine is half of eighteen. Drawing bars by counting one book for each interval would disagree with the scale. Students can check a graph against the stated totals and correct the representation before doing the comparison. Category names alone do not determine bar lengths.
Try a changed shelf
Add three history books while keeping the other categories unchanged. The history bar extends one more interval to twelve. History and science then total twenty-seven, nine more than fiction. Explain why the comparison increases by three. Use this task as an entry point to drawing and interpreting other scaled graphs in the school’s Grade 3 sequence. The fictional counts supply clear arithmetic; they are not observations from a surveyed Louisiana classroom.
Math standards transition: The updated standards were approved in March 2026. The 2026–27 learning year continues current classroom standards, and spring 2027 LEAP uses them. Full implementation of the updated standards begins in 2027–28. Read the official transition FAQ and updated standards (PDF).
Selected references from Louisiana mathematics standards
The Louisiana mathematics standards directory lists current and updated standards. For 2026–27, use the current K–12 document, updated December 21, 2017; the revised standards have full implementation in 2027–28. These selected references identify the worked activity’s focus. The expectations include numbered requirements, examples, and mathematical practices. Read the full document and confirm the school’s current instructional sequence.
| Adopted-document reference | Activity focus | Official document |
|---|---|---|
| 3.MD.B.3 | Use scaled graphs for comparisons | Read the state PDF, page 20 |
Sources checked October 6, 2026. Read complete requirements, clarifications, limitations, and mathematical practices alongside the school’s sequence. This selected activity is an entry point for instruction.
Connect the explanation with practice
Use the lesson, worksheet, and quiz directory to choose a related skill. The existing resource links remain available; open each activity’s directions to understand its timer, tools, question count, and scoring.
Grade 3 is within Louisiana’s general LEAP mathematics testing range. The linked learning resources have their own directions and scoring; a practice score does not establish an official state performance level. Read Louisiana’s assessment overview.
Keep one example of the student’s reasoning with the practice result. Choose a smaller model, a related question, or a new context according to the difficulty revealed in the worked activity.
Louisiana Grade 3 Math Topics
Choose a lesson, printable worksheet collection, or topic quiz. This broader library includes review and enrichment. Use the school’s current sequence and the current Louisiana document when choosing skills; these rows are not a certified full-course crosswalk.
Standards source: Louisiana Student Standards, Louisiana Department of Education.
Place Value & Number Sense
Addition & Subtraction
Multiplication
Division
Problem Solving & Patterns
Fractions
Measurement, Time & Data
Best Louisiana LEAP Grade 3 Math Books
Each book has a job: start from scratch, drill weak skills, or build pacing with full tests. All of them pair with the free tools on this page.
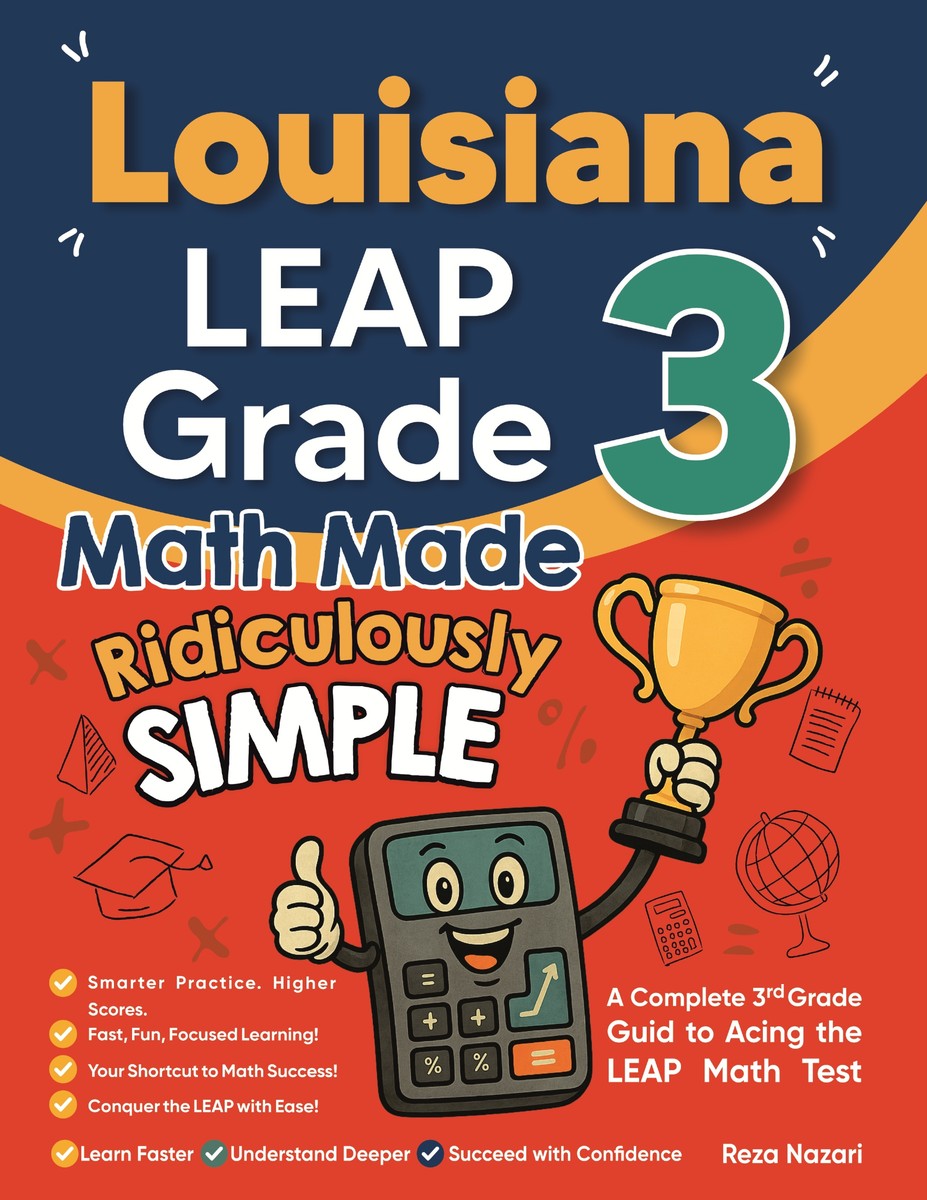
Louisiana LEAP Grade 3 Math Made Ridiculously Simple
An independently published Grade 3 mathematics resource. Check its edition and contents against Louisiana’s current document and the school’s course before choosing preparation.
- Best starting point for the LEAP math test
- Pairs with Louisiana flashcards and worksheets
- Use it before full timed practice tests
- Organized for students who need examples before drills
Step-by-step lessons
Short explanations show the move before the student practices it.
✍Worked examples
Examples translate LEAP-style wording into clear math steps.
Targeted practice
Rebuild one skill at a time instead of jumping around.
Test-day bridge
After each topic, connect to formulas, flashcards, and practice questions.
How to use it
- Read one lesson and copy the worked example.
- Do a short worksheet set on the same topic.
- Review the matching flashcards or formulas.
- Try a mixed quiz and mark every miss.
Pair it with free tools
Choose the right Louisiana Grade 3 math book
Louisiana LEAP Grade 3 Math Made Ridiculously Simple
Start here for Louisiana Grade 3 math, step by step.
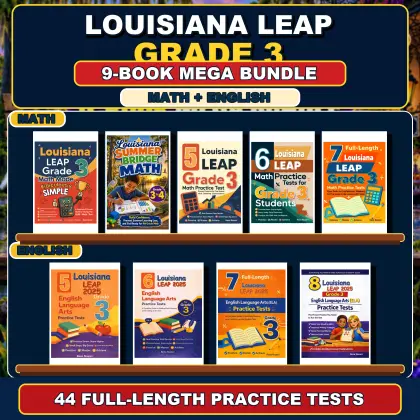
Louisiana LEAP Grade 3 Math & ELA Mega Bundle
9 books and 44 full-length practice tests in one TPT bundle.
Louisiana Grade 3 math: useful study questions
Why do eight graph intervals represent twenty-four books?
The scale is three books per interval. Three history intervals and five science intervals total eight intervals, which represent 8 × 3 = 24 books.
Which mathematics standards apply in 2026–27?
Louisiana’s transition FAQ directs schools to continue current standards in the 2026–27 learning year. Spring 2027 LEAP assesses current standards; full implementation of the updated standards begins in 2027–28. Use the current K–12 document and the school’s instructional sequence.
Grade 3 Math in Other States
Explore Grade 3 math standards, practice tests, and worksheets for every state.
- Alabama
- Alaska
- Arizona
- Arkansas
- California
- Colorado
- Connecticut
- Delaware
- Florida
- Georgia
- Hawaii
- Idaho
- Illinois
- Indiana
- Iowa
- Kansas
- Kentucky
- Maine
- Maryland
- Massachusetts
- Michigan
- Minnesota
- Mississippi
- Missouri
- Montana
- Nebraska
- Nevada
- New Hampshire
- New Jersey
- New Mexico
- New York
- North Carolina
- North Dakota
- Ohio
- Oklahoma
- Oregon
- Pennsylvania
- Rhode Island
- South Carolina
- South Dakota
- Tennessee
- Texas
- Utah
- Vermont
- Virginia
- Washington
- West Virginia
- Wisconsin
- Wyoming
- District of Columbia
Make This Your Louisiana LEAP Starting Point
Take a timed practice test, find your weakest topic, and study it with the linked lessons, worksheets, and the LEAP study guide.
Start a practice testA USEFUL NEXT STEP
Louisiana Grade 3 Math: study questions
Why do eight graph intervals represent twenty-four books?
The scale is three books per interval. Three history intervals and five science intervals total eight intervals, which represent 8 × 3 = 24 books.
Which mathematics standards apply in 2026–27?
Louisiana’s transition FAQ directs schools to continue current standards in the 2026–27 learning year. Spring 2027 LEAP assesses current standards; full implementation of the updated standards begins in 2027–28. Use the current K–12 document and the school’s instructional sequence.
Official source ↗Resources from Effortless Math · Editorial standards