Using a Linear Model: Complete Guide with Video and Examples

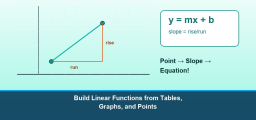
Once a line of best fit has been found and its equation written as \(y = mx + b\), the equation becomes a linear model. You can substitute any \(x\)-value into the model to predict the corresponding \(y\)-value, or substitute a known \(y\)-value and solve for \(x\). A key skill is interpreting what the slope and intercept mean in context — the slope tells you the rate of change per unit of \(x\), and the \(y\)-intercept gives the predicted value of \(y\) when \(x = 0\). Always check whether a prediction is reasonable given the real-world situation and the range of the original data.
Understanding using a linear model becomes much easier when you reduce each problem to a repeatable checklist. Start by identifying the important relationship in the problem, then use it consistently: Linear model: \(y=mx+b\); Slope \(m\): rate of change; for every 1-unit increase in \(x\), \(y\) increases (or decreases) by \(m\).
This topic matters because it connects basic skills to more advanced algebra, geometry, statistics, or modeling. When students can explain why a method works instead of memorizing isolated steps, they solve unfamiliar problems with much more confidence.
Watch the Video Lesson
If you want a quick visual walkthrough before practicing on your own, start with this lesson.
Understanding Using a Linear Model
Once a line of best fit has been found and its equation written as \(y = mx + b\), the equation becomes a linear model. You can substitute any \(x\)-value into the model to predict the corresponding \(y\)-value, or substitute a known \(y\)-value and solve for \(x\). A key skill is interpreting what the slope and intercept mean in context — the slope tells you the rate of change per unit of \(x\), and the \(y\)-intercept gives the predicted value of \(y\) when \(x = 0\). Always check whether a prediction is reasonable given the real-world situation and the range of the original data.
A strong approach to using a linear model is to slow down just enough to label the important quantities, recognize the governing rule, and check whether the final answer makes sense. That habit keeps small arithmetic mistakes from turning into bigger conceptual mistakes.
Students usually improve fastest when they practice explaining each step aloud. If you can say what the rule means, why it applies, and how the answer should behave, then using a linear model becomes much more manageable on classwork, homework, and tests.
Key Ideas to Remember
- Linear model: \(y=mx+b\)
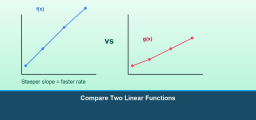
- Slope \(m\): rate of change; for every 1-unit increase in \(x\), \(y\) increases (or decreases) by \(m\).
- \(y\)-intercept \(b\): predicted value of \(y\) when \(x=0\).
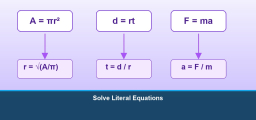
- Solving for \(x\): substitute the target \(y\) and solve using inverse operations.
Worked Examples
Example 1
Problem: A model for weekly online store revenue is \(R = 120n + 500\), where \(n\) is the number of new customers that week and \(R\) is revenue in dollars. (a) What does the slope represent? (b) What does the \(R\)-intercept represent? (c) Predict revenue when \(n = 40\) new customers.
Solution: (a) Each additional new customer brings in
(120 of revenue.
(b) Even with no new customers (\)n=0\(), base revenue is
)500 (from returning customers).
(c) \(R=120(40)+500=4800+500=
)5300$.
Answer: (a)
(120/customer; (b)
)500 base; (c) \$5300

Example 2
Problem: Using \(R = 120n + 500\), how many new customers are needed to reach a weekly revenue target of \$3500?
Solution: \(3500=120n+500\Rightarrow 120n=3000\Rightarrow n=25\) new customers.
Answer: \(n=25\) new customers
Example 3
Problem: A linear model for total cost is \(C = 2.5n + 15\), where \(n\) is the number of items. What is the predicted cost for 12 items, and what does 15 represent?
Solution: Substitute \(n = 12\): \(C = 2.5(12) + 15 = 30 + 15 = 45\). The constant term 15 is the starting value, so it represents a fixed fee before any per-item cost is added.
Answer: \(45\); the 15 is the fixed starting cost
Common Mistakes
- Confusing the slope with the starting value.
- Using a linear model when the data trend is clearly not linear.
- Making predictions without paying attention to the meaning of the variables and units.
Practice Problems
Try these on your own before checking a textbook or notes. The goal is to explain the method, not just state a final answer.
- y when x=5
- y when x=0
- x when y=60
- x when y=12
- Slope means: \rule{2.2cm}{0.4pt} cm/week
- C when t=10
Study Tips
- The slope always carries units: e.g.\ “\$120 per new customer” or “3 fewer chirps per degree Celsius.” Stating units shows you understand the real-world meaning.
- The \(y\)-intercept is sometimes meaningful (base value, starting amount) and sometimes not (e.g.\ height at \(x=0\) weeks may be the seed length at planting). Always check the context.
- Before using a model for prediction, ask: is it reasonable for my \(x\)-value to exist in reality? A negative number of customers or a temperature of \(-200 ^\circ\)C makes no sense.
Final Takeaway
Using a Linear Model is easier when you focus on the structure of the problem instead of chasing isolated tricks. Use the core rule, keep your work organized, and make one quick reasonableness check before you finish.
Once that process becomes automatic, you can move through more challenging questions with much more speed and accuracy. Rework the examples above, solve the practice set, and then come back to using a linear model again after a day or two to make the skill stick.

Related to This Article
More math articles
- DAT Math Flashcards (Free Online: Formulas, Terms & Concepts)
- How to Solve Systems of Equations Graphically?
- How to Choose the Best Backup Software Solution for School Districts?
- How to Modeling Real-World Situations Using Functions
- The Best Grade 7 Math Book for Texas Students
- Kansas KAP Grade 3 Math Prep, the Calm Way: 49 Free Single-Skill Worksheet PDFs
- Top 10 HSPT Math Practice Questions
- Area Models Unfolded: How to Multiplying Decimals by Two-digit Whole Numbers
- Top 10 Tips to Overcome ISEE Math Anxiety
- SAT Math Flashcards (Free Online: Formulas, Terms & Concepts)


What people say about "Using a Linear Model: Complete Guide with Video and Examples - Effortless Math"?
No one replied yet.