Box and Whisker Plot Maker (Five-Number Summary Calculator)
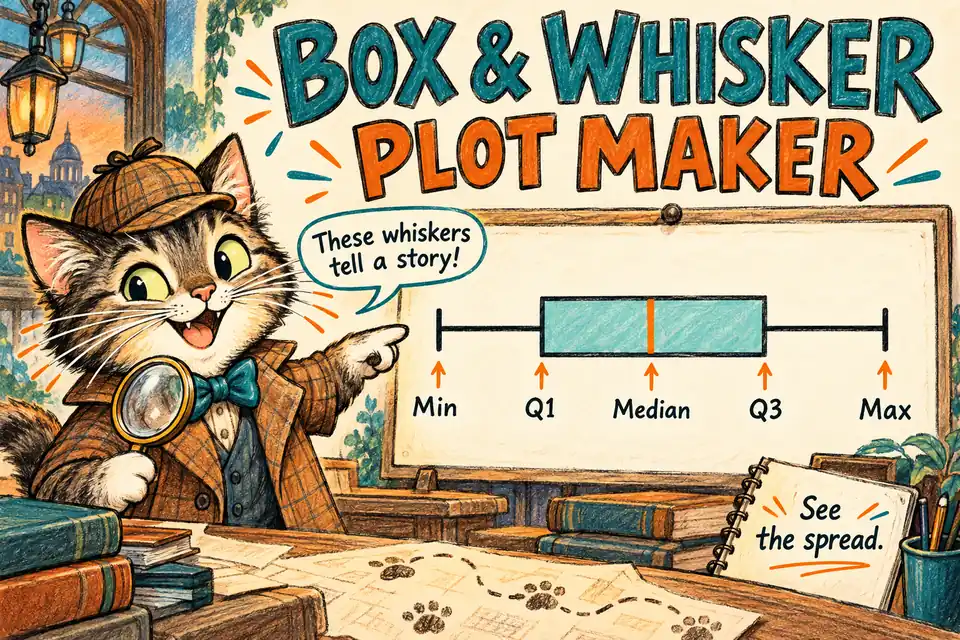
A box and whisker plot maker turns a list of numbers into its five-number summary (minimum, Q1, median, Q3, maximum) and draws the box plot for you. Paste your data below to get the IQR, the 1.5 × IQR outlier fences, any outliers, and a plot you can download, with every step written out the way you would show it on paper.
How to use the Box and Whisker Plot Maker
- Type or paste your data into the box. Separate the numbers with commas, spaces or line breaks; they do not need to be in order.
- Add an axis label if you want one (for example, “Quiz scores”).
- Press Make plot or the Enter key.
- Read the five-number summary, IQR, range and fences, then check the step-by-step working.
- Use Download PNG or Download SVG to save the plot for homework, slides or a worksheet.
How to make a box and whisker plot by hand
Every box plot comes from the same five steps: sort the data, find the median, find Q1 and Q3 from the two halves, compute the IQR, then check for outliers. Here are two complete examples, one with an odd number of values and one with an even number.
Example 1: an odd number of values
Data: 6, 9, 3, 12, 8, 5, 10, 7, 15
- Sort: 3, 5, 6, 7, 8, 9, 10, 12, 15. There are 9 values.
- Median: the middle value is the 5th one, so the median is 8.
- Because 9 is odd, leave the 8 out. Lower half: 3, 5, 6, 7, so Q1 = (5 + 6) ÷ 2 = 5.5.
- Upper half: 9, 10, 12, 15, so Q3 = (10 + 12) ÷ 2 = 11.
- IQR = 11 − 5.5 = 5.5, and range = 15 − 3 = 12.
- Fences: 1.5 × 5.5 = 8.25. Lower fence = 5.5 − 8.25 = −2.75. Upper fence = 11 + 8.25 = 19.25. Every value is between −2.75 and 19.25, so there are no outliers.
Five-number summary: 3, 5.5, 8, 11, 15. Draw a number line, a box from 5.5 to 11 with a line at 8, and whiskers out to 3 and 15.
Example 2: an even number of values with an outlier
Data: 14, 22, 18, 16, 20, 15, 19, 17, 41, 21
- Sort: 14, 15, 16, 17, 18, 19, 20, 21, 22, 41. There are 10 values.
- Median: the 5th and 6th values are 18 and 19, so the median is (18 + 19) ÷ 2 = 18.5.
- Lower half (first 5 values): 14, 15, 16, 17, 18, so Q1 = 16.
- Upper half (last 5 values): 19, 20, 21, 22, 41, so Q3 = 21.
- IQR = 21 − 16 = 5, and range = 41 − 14 = 27.
- Fences: 1.5 × 5 = 7.5. Lower fence = 16 − 7.5 = 8.5. Upper fence = 21 + 7.5 = 28.5. Since 41 is greater than 28.5, it is an outlier.
In a modified box plot, the right whisker stops at 22 (the largest value that is not an outlier) and 41 is drawn as a separate dot. The box still runs from 16 to 21 with the median line at 18.5.
Box plot quick reference
| Term | What it means | How to find it |
|---|---|---|
| Minimum / maximum | Smallest and largest values | First and last values after sorting |
| Median (Q2) | Middle of the data | Middle value, or mean of the two middle values |
| Q1 | Middle of the lower half | Median of the values below the median |
| Q3 | Middle of the upper half | Median of the values above the median |
| IQR | Spread of the middle 50% | Q3 − Q1 |
| Range | Spread of all the data | Maximum − minimum |
| Fences | Cutoffs for outliers | Q1 − 1.5 × IQR and Q3 + 1.5 × IQR |
Common mistakes to avoid
- Not sorting first. The median and quartiles only make sense on ordered data. Finding the “middle” of an unsorted list gives a wrong answer.
- Including the median in both halves when the count is odd. With the school method, the median belongs to neither half.
- Reading the box length as “more data.” Each section of the plot holds about a quarter of the values. A longer section means those values are more spread out.
- Drawing whiskers to an outlier. If a value is outside the fences, the whisker ends at the last value inside them and the outlier gets its own dot.
- Uneven number line. Use equal spacing on the axis, or the plot will misrepresent the spread.
Where box plots show up in school
Box plots are introduced in grade 6. The Common Core standard 6.SP.B.4 asks students to display numerical data in plots on a number line, including box plots, and 6.SP.B.5c covers the median and interquartile range as measures of center and variability. In grade 7, students use box plots to compare two groups side by side. In high school, standard S-ID.A.1 returns to dot plots, histograms and box plots, and statistics courses add the 1.5 × IQR rule for outliers.
Box plots are useful because they show the center, spread and skew of a data set in one picture, and two box plots on the same axis make a fast comparison. They do not show the mean or every individual value, so for those, a dot plot or a standard deviation calculator is a better fit. To practice the median and range on their own, try these mean, median, mode and range practice problems, and for quartiles as percentiles see the percentile calculator.
Check your answer
Count the values in each part of your plot. From the minimum to Q1, Q1 to the median, the median to Q3, and Q3 to the maximum, each section should hold about one quarter of the data. Also confirm that Q1 is not larger than the median and the median is not larger than Q3. If either check fails, re-sort the data and recount the halves.
Box and whisker plots practice quiz: 10 questions
Test yourself with 10 multiple-choice questions. Choose an answer and press Submit to see if you are right and why. Your score appears at the end.
IQR = Q3 − Q1 = 12.5 − 6 = 6.5. 12 is the range (15 − 3), not the IQR.
The five-number summary is minimum, Q1, median, Q3 and maximum. The mean is not shown on a box plot.
The fences are 10 − 12 = −2 and 18 + 12 = 30. Only 31 lies outside that range.
The box runs from Q1 to Q3, with a line at the median. The whiskers reach to the minimum and maximum (or the fences).
Quiz complete
Frequently asked questions
What is the five-number summary?
The five-number summary is the minimum, first quartile (Q1), median, third quartile (Q3) and maximum of a data set. These five values are exactly what a box and whisker plot draws: the whiskers reach toward the minimum and maximum, and the box runs from Q1 to Q3 with a line at the median.
Do you include the median when finding Q1 and Q3?
With the method taught in most US middle and high school classes, no. When the number of values is odd, you leave the median out and find the median of each half. When the number of values is even, the data splits into two equal halves and nothing is left out. This box and whisker plot maker uses that method.
How do you find outliers for a box plot?
Use the 1.5 × IQR rule. Compute IQR = Q3 − Q1, then the lower fence Q1 − 1.5 × IQR and the upper fence Q3 + 1.5 × IQR. Any value below the lower fence or above the upper fence is an outlier. It is drawn as a separate dot, and the whisker stops at the most extreme value that is not an outlier.
Why does my calculator or spreadsheet give a different Q1 and Q3?
There are several accepted ways to define quartiles. TI-83/84 calculators use the median-of-halves method shown here, while spreadsheet functions such as QUARTILE.INC interpolate between data values. For the data 3, 5, 6, 7, 8, 9, 10, 12, 15, the median-of-halves method gives Q1 = 5.5 and Q3 = 11, but QUARTILE.INC gives 6 and 10. Use the method your class or textbook uses.
What does the box in a box and whisker plot represent?
The box covers the middle half of the data, from Q1 to Q3. Its length is the interquartile range. About 25% of the values lie in each whisker section and in each part of the box, so a long section means those values are spread out, not that there are more of them.

Related to This Article
More math articles
- Why Teaching Math At Home Is Beneficial For Your Kids?
- Top 10 Tips to Create an AFOQT Math Study Plan
- OAE Elementary Education Math Flashcards
- Trigonometric Integrals: A Thorough Guide On Everything You Need To Know
- Free Grade 6 English Worksheets for Connecticut Students
- Fluid Mosaic Model: Membrane Structure and Fluidity
- Is your child ready for algebra 1?
- Marx, Durkheim, and Weber
- How to Decipher Algebra 1: The Key to Success with ‘Algebra 1 for Beginners’ Solution Guide”
- Understanding Fractions for 5th Grade: Parts of a Whole and Division











What people say about "Box and Whisker Plot Maker + Five-Number Summary"?
No one replied yet.