8th Grade MAP Math Worksheets: FREE & Printable
8th Grade MAP Math Worksheets: a free, printable set you can download and use right away, with answer keys, organized by topic so students can practice one skill at a time and teachers can assign exactly what a lesson needs.
Quick answer: The 8th grade MAP test is NWEA's MAP Growth, a computer-adaptive test: questions get harder after correct answers and easier after misses, and the result is a RIT score. In NWEA's 2025 norms, the average 8th grade math score is 222 in fall, 226 in winter and 229 in spring. The worksheets below practice the same 8th grade skills, from linear functions to solid figures.
For additional educational resources
Looking for free printable MAP Math worksheets and exercises to help your 8th-grade students prepare for the 8th Grade MAP Mathematics test?

Need 8th Grade MAP Mathematics Practice exercises and activities to measure your students’ exam readiness? If so, then look no further.
Here is a comprehensive collection of FREE 8th Grade Mathematics worksheets that would help your students in 8th Grade MAP Math preparation and practice.
Download our free Mathematics worksheets for the 8th Grade MAP test.
Hope you enjoy it!
IMPORTANT: COPYRIGHT TERMS: These worksheets are for personal use. Worksheets may not be uploaded to the internet in any form, including classroom/personal websites or network drives. You can download the worksheets and print as many as you need. You have permission to distribute the printed copies to your students, teachers, tutors, and friends.
You Do NOT have permission to send these worksheets to anyone in any way (via email, text messages, or other ways). They MUST download the worksheets themselves. You can send the address of this page to your students, tutors, friends, etc.
Related Topics
- Grade 4 MAP Math Worksheets
- Grade 5 MAP Math Worksheets
- Grade 6 MAP Math Worksheets
- Grade 7 MAP Math Worksheets
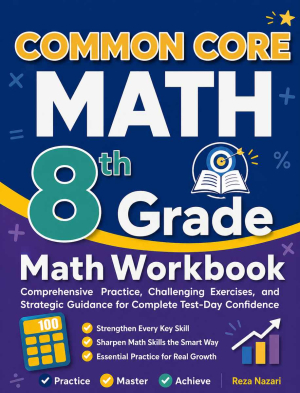
The Absolute Best Book to Ace 8th Grade MAP Math Test!
8th Grade MAP Mathematics Concepts
Whole Numbers
- Rounding
- Whole Number Addition and Subtraction
- Whole Number Multiplication and Division
- Rounding and Estimates
Fractions and Decimals
- Simplifying Fractions
- Adding and Subtracting Fractions
- Multiplying and Dividing Fractions
- Adding and Subtracting Mixed Numbers
- Multiplying and Dividing Mixed Numbers
- Adding and Subtracting Decimals
- Multiplying and Dividing Decimals
- Comparing Decimals
- Rounding Decimals
- Factoring Numbers
- Greatest Common Factor
- Least Common Multiple
Real Numbers and Integers
- Adding and Subtracting Integers
- Multiplying and Dividing Integers
- Order of Operations
- Ordering Integers and Numbers
- Integers and Absolute Value
Proportions, Ratios, and Percent
- Simplifying Ratios
- Proportional Ratios
- Similarity and Ratios
- Ratio and Rates Word Problems
- Percentage Calculations
- Percent Problems
- Discount, Tax and Tip
- Percent of Change
- Simple Interest
Algebraic Expressions
- Simplifying Variable Expressions
- Simplifying Polynomial Expressions
- Translate Phrases into an Algebraic Statement
- The Distributive Property
- Evaluating One Variable Expressions
- Evaluating Two Variables Expressions
- Combining like Terms
Equations and Inequalities
- One-Step Equations
- Multi-Step Equations
- Graphing Single, Variable Inequalities
- One-Step Inequalities
- Multi-Step Inequalities
- Systems of Equations
- Systems of Equations Word Problems
- Quadratic Equation
Linear Functions
- Finding Slope
- Graphing Lines Using Line Equation
- Writing Linear Equations
- Graphing Linear Inequalities
- Finding Midpoint
- Finding Distance of Two Points
Exponents and Radicals
- Multiplication Property of Exponents
- Zero and Negative Exponents
- Division Property of Exponents
- Powers of Products and Quotients
- Negative Exponents and Negative Bases
- Scientific Notation
- Square Roots
The Best Math Study Guide for 8th Grade MAP Math Test!
Polynomials
- Writing Polynomials in Standard Form
- Simplifying Polynomials
- Adding and Subtracting Polynomials
- Multiplying Monomials
- Multiplying and Dividing Monomials
- Multiplying a Polynomial and a Monomial
- Multiplying Binomials
- Factoring Trinomials
- Operations with Polynomials
Geometry and Solid Figures
- Angles
- Pythagorean Relationship
- Triangles
- Polygons
- Trapezoids
- Circles
- Cubes
- Rectangular Prism
- Cylinder
- Pyramids and Cone
Statistics and Probability
- Mean and Median
- Mode and Range
- Histograms
- Stem, and, Leaf Plot
- Pie Graph
- Probability Problems
- Combinations and Permutations
The BEST Practice Book for 8th Grade MAP Math Test!
8th Grade MAP Math Exercises
Fractions and Decimals
Real Numbers and Integers
Proportions and Ratios
Percent
Algebraic Expressions
Equations and Inequalities
Linear Functions
Polynomials
Systems of Equations
Exponents and Radicals
Statistics
Geometry
Solid Figures
Function Operations
Looking for the best resources to help your students succeed on the MAP Math test?
The Best Books to Ace the MAP Math Test!
What 8th Grade MAP Math RIT Scores Mean
A RIT score is not a percent correct. It places a student on one scale that runs across grades, so a fall score and a spring score can be compared directly. NWEA’s 2025 norms give these averages for math:
| Grade | Fall average (SD) | Winter average (SD) | Spring average (SD) |
|---|---|---|---|
| Grade 7 | 217 (17) | 221 (18) | 224 (19) |
| Grade 8 | 222 (18) | 226 (19) | 229 (20) |
SD is the standard deviation, a measure of how spread out scores are. An 8th grader who scores 240 in fall is one standard deviation above the fall average (222 + 18), well above most classmates. A score near 222 in fall is right at the national average.
Growth matters as much as the number itself. The 8th grade average rises by 7 points from fall to spring, so a student who climbs more than that during the year is gaining ground.
Turning a MAP Report Into a Worksheet Plan
The score report breaks math into goal areas. Use the weakest one to choose where to start on this page.
- Find the lowest goal area on the report, for example algebraic thinking or geometry.
- Match it to the worksheet groups above: Linear Functions and Equations and Inequalities for algebra, Geometry and Solid Figures for geometry, Statistics and Probability for data.
- Do one worksheet, check it with the answer key, and redo every missed problem without looking.
- Move to the next worksheet in that group only when the first one is mostly correct.
- Mix in one review worksheet a week from an older topic, such as fractions or percent, so earlier skills stay fresh before the next testing window.
Frequently Asked Questions
What is a good MAP math score for an 8th grader?
Compare the score to NWEA’s 2025 averages for 8th grade math: 222 in fall, 226 in winter and 229 in spring. A score above the average for that season is above the national middle. Many teachers care just as much about growth, so a student who rises more than about 7 points from fall to spring is making strong progress.
What math is on the 8th grade MAP test?
The 8th grade MAP Growth math test covers number sense, expressions and equations, functions, geometry, and statistics and probability. Typical skills include linear equations and slope, exponent rules and scientific notation, the Pythagorean theorem, volume of cylinders, cones and spheres, and scatter plots. Because it is adaptive, a strong student may also see some higher level questions.
Why can my child’s MAP score go down between tests?
Small drops are common. A RIT score is an estimate, so a few points up or down can come from a tired day, rushing, or the particular questions a student received. Look at the trend across several testing windows and at the goal areas, not one number, before drawing conclusions.
Do these 8th grade worksheets have answer keys?
Yes. The page says each worksheet comes with an answer key, so students can check their own work. A good routine is to finish the whole worksheet first, then check, then redo each missed problem on a fresh sheet of paper without looking at the key.

Related to This Article
More math articles
- Two-Column Proofs: How to Write Statements and Reasons
- CPA REG Agency vs Contract Liability: Read the Legal Relationship (2027 Prep)
- How to Write Polynomials in Standard Form? (+FREE Worksheet!)
- How to Graph the Cosine Function?
- Free Grade 8 English Worksheets for Pennsylvania Students
- What Skills Do I Need for the ASVAB Math Subtests?
- Free Grade 8 English Worksheets for Kentucky Students
- How to Solve Venn Diagrams and the Addition Rule?
- Monopsony MRC: Calculate Hiring Cost, Then Read the Wage
- The Best Grade 4 ELA Practice Tests for Nebraska Students










What people say about "8th Grade MAP Test Math Worksheets, Free and Printable"?
No one replied yet.