The Normal Distribution and the 68-95-99.7 Rule: 2026 Guide

The normal distribution shows up everywhere: test scores, IQ, blood pressure, heights, weights, manufacturing tolerances, polling results, even daily stock returns. Almost every introductory statistics course spends a full week on it, and every AP Statistics and SAT problem set returns to it again and again. Get fluent with the curve and the 68-95-99.7 rule, and a third of statistics becomes easy.
This guide covers what the normal distribution is, the empirical rule that captures most of what you need to know, z-scores, and the most-tested problem types.
What the Normal Distribution Looks Like
A normal distribution is a symmetric, bell-shaped curve. Its shape is determined entirely by two numbers:
- Mean (μ): the center, where the peak is.
- Standard deviation (σ): the spread, how wide the curve is.
The curve is symmetric around the mean: half the area is to the left, half to the right.
The 68-95-99.7 Rule (The Empirical Rule)
For any normal distribution:
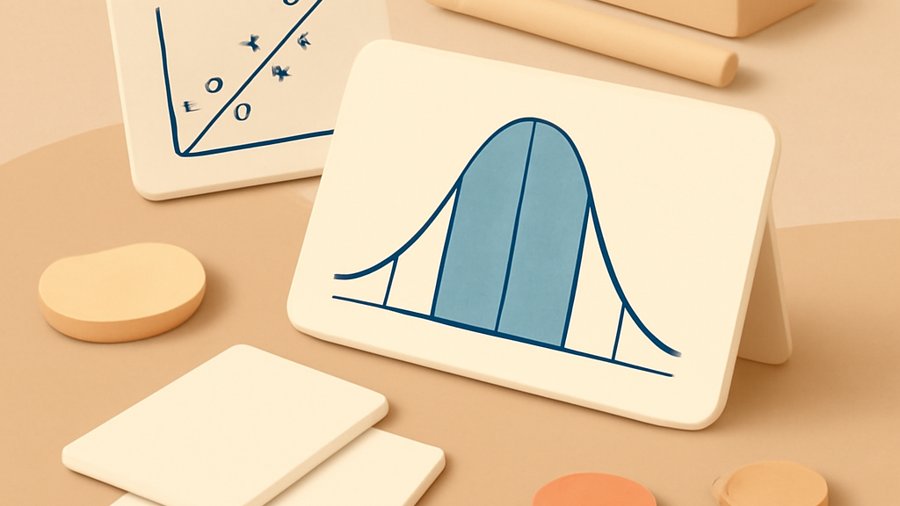
- About 68% of data falls within 1 standard deviation of the mean (μ ± σ).
- About 95% falls within 2 standard deviations (μ ± 2σ).
- About 99.7% falls within 3 standard deviations (μ ± 3σ).
This is the single most useful fact in statistics. Memorize it cold.
Worked Example 1
IQ scores are normally distributed with mean 100 and standard deviation 15.
- 68% of people have IQ between 85 and 115.
- 95% have IQ between 70 and 130.
- 99.7% have IQ between 55 and 145.
That accounts for almost everyone.
Worked Example 2: Tail Probabilities
If 95% fall within μ ± 2σ, then 5% fall outside that range. By symmetry, 2.5% are above μ + 2σ and 2.5% are below μ − 2σ.
What percent of IQs are above 130?
130 is μ + 2σ. About 2.5%.What percent are below 70?
70 is μ − 2σ. About 2.5%.
Worked Example 3: One-Sided Areas
If 68% are within μ ± σ, then 32% are outside. By symmetry, 16% are above μ + σ and 16% below μ − σ.
What percent are above 115 (μ + σ)?
16%.What percent are below 115?
50% (everyone below mean) + 34% (between mean and σ) = 84%.
The trick: split the curve into pieces by σ, 2σ, 3σ on each side of the mean and use the empirical rule percentages.
The Six Standard Pieces
The empirical rule divides the curve into six standard pieces:
| Range | Approximate area |
|---|---|
| μ − 3σ to μ − 2σ | 2.35% |
| μ − 2σ to μ − σ | 13.5% |
| μ − σ to μ | 34% |
| μ to μ + σ | 34% |
| μ + σ to μ + 2σ | 13.5% |
| μ + 2σ to μ + 3σ | 2.35% |
Beyond μ ± 3σ: about 0.15% on each tail.
These six pieces plus the two tails add to 100%. Almost every empirical-rule problem is about combining these pieces.
Z-Scores: The Universal Translator
A z-score tells you how many standard deviations a value is from the mean.
\[z = \frac{x – \mu}{\sigma}\]
A test has mean 75 and SD 5. A score of 82 has z = (82 − 75)/5 = 1.4.
The score is 1.4 standard deviations above the mean.
Z-scores convert any normal distribution into the standard normal distribution (mean 0, SD 1). Once you have a z-score, you can use a single table (or your calculator’s normalcdf function) to find areas.
Reading a Z-Table
A z-table gives the area to the left of a z-score.

- z = 0 → area = 0.5000 (half the curve).
- z = 1 → area ≈ 0.8413.
- z = 2 → area ≈ 0.9772.
- z = −1 → area ≈ 0.1587.
- z = −2 → area ≈ 0.0228.
To find the area between two z-scores, subtract.
Area between z = −1 and z = 1: 0.8413 − 0.1587 = 0.6826. That’s the 68% from the empirical rule. ✓
Worked Example 4
The lifespan of a light bulb is normally distributed with mean 1,000 hours and SD 100 hours. What percent of bulbs last more than 1,200 hours?
Step 1: Convert 1,200 to a z-score. z = (1,200 − 1,000)/100 = 2.
Step 2: Look up z = 2 → area to the left ≈ 0.9772.
Step 3: Subtract from 1: 1 − 0.9772 = 0.0228. About 2.28%.
You could shortcut this with the empirical rule: 1,200 is μ + 2σ, so about 2.5% of bulbs last longer. Close enough for a rough estimate.
Worked Example 5: Inverse Lookup
SAT math scores are normally distributed with mean 528 and SD 117. What score is in the top 10%?
Top 10% means the 90th percentile. Look up the z-score where area is 0.9000.
z ≈ 1.28.
Convert back: x = μ + zσ = 528 + 1.28 · 117 ≈ 528 + 150 = 678.
A 678 is at the 90th percentile.
When the Normal Distribution Applies
A distribution is approximately normal when:
- The data is the sum or average of many small independent influences (Central Limit Theorem).
- The histogram is symmetric, single-peaked, and bell-shaped.
- The data is continuous (heights, weights, blood pressure, time).
Not normal:
- Income (right-skewed, long tail of high earners).
- Counts of rare events (Poisson, not normal).
- Bimodal data (two peaks).
If a question shows a clearly skewed histogram, the empirical rule does not apply.
Common Mistakes
- Using the empirical rule for non-normal data. It only works for bell curves.
- Mixing up 68 and 95. 68% is within 1σ; 95% is within 2σ. Practice until automatic.
- Forgetting the tails. Within μ ± 2σ is 95%; outside is 5%, split as 2.5% on each side.
- Calculating z with the wrong sign. z is negative when x is below the mean.
- Using mean as a z-score. μ corresponds to z = 0 (50th percentile).
A Quick Cheat Sheet
| Probability | Range |
|---|---|
| 50% | Above μ (or below μ) |
| 68% | μ ± σ |
| 95% | μ ± 2σ |
| 99.7% | μ ± 3σ |
| 34% | μ to μ + σ |
| 13.5% | μ + σ to μ + 2σ |
| 2.35% | μ + 2σ to μ + 3σ |
| 2.5% (approx.) | Above μ + 2σ |
Frequently Asked Questions
Is the normal distribution on the SAT?
Yes, lightly. The Digital SAT includes some questions about z-scores and the empirical rule.
Is it on the ACT?
Less often than the SAT, but yes occasionally.
What is the AP Statistics weighting?
The normal distribution and its applications (z-scores, percentiles, inverse normal) account for roughly 15% of the exam.
What if my data is not normal?
Use other tools: median, IQR, Chebyshev’s inequality, or non-parametric tests. The empirical rule does not apply.
Why is the normal distribution so common?
The Central Limit Theorem: the sum or average of many small independent factors tends toward a normal distribution, even when the individual factors are not normal themselves.
Closing Thought
The normal distribution is a symmetric bell curve described by mean and standard deviation. The empirical rule (68, 95, 99.7) and z-scores convert it into a problem you can solve in under a minute. Memorize the six standard pieces, drill a dozen z-score problems, and a third of AP Statistics becomes routine.
For more practice, browse our Statistics worksheets and our full Math Topics library. When you are ready for a structured workbook, our Statistics collection covers the normal distribution and inferential statistics in depth.

Related to This Article
More math articles
- How to Graph Functions
- Order of Operations (PEMDAS): Why It Matters and How to Master It
- South Dakota SBAC Grade 8 Math Free Worksheets: Printable Standards-Aligned Practice PDFs, Free
- The Math Behind Horse Racing Strategies: Odds & Probabilities
- Free Grade 8 English Worksheets for Tennessee Students
- Best Calculators for CA Exams
- Top 10 Tips to Overcome ATI TEAS 7 Math Anxiety
- The Best Grade 3 Math Book for Iowa Students
- Top 10 PSAT 8/9 Math Prep Books (Our 2026 Favorite Picks)
- How to Define Limits Analytically Using Correct Notation?


What people say about "The Normal Distribution and the 68-95-99.7 Rule: 2026 Guide - Effortless Math"?
No one replied yet.