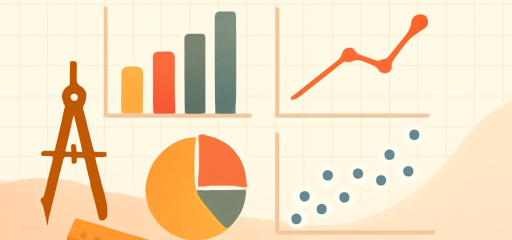
How to Read and Interpret Graphs: Bar, Line, Pie & Scatter
Data interpretation is one of the highest-yield topics on every standardized test. The SAT, ACT, GED, TEAS, GRE, ASVAB, and ACCUPLACER all include several graph-based questions. The math is usually simple — the hard part is reading the graph correctly under pressure.
This guide walks you through the four main types of graphs, the questions they get asked, and the traps test-writers love.
The 4 Graphs You Will See
| Graph | Shows | Best for |
|---|---|---|
| Bar graph | Comparing categories | Discrete values |
| Line graph | Change over time | Trends |
| Pie chart | Parts of a whole | Proportions |
| Scatter plot | Relationship between two variables | Correlation |
Reading Any Graph: 4 Steps
Before answering a single question, do these in order:

- Read the title. What is the graph about?
- Read both axes. What is on each axis, and in what units?
- Read the legend. If there are multiple bars or lines, what does each color/pattern mean?
- Notice the scale. Does the y-axis start at 0? Is it linear or logarithmic? What is each gridline worth?
Spending 15 seconds on these four steps will save you minutes — and answer many questions before you read them.
Bar Graphs
Bar graphs compare categories. Each bar’s height (or length) represents a quantity.
What to read
- The category (x-axis label).
- The value (height of the bar, measured against the y-axis).
Typical questions
- “Which category has the highest value?” → Find the tallest bar.
- “What is the difference between A and B?” → Subtract.
- “What is the total of all categories?” → Add them up.
- “What percent of the total does category C represent?” → \(\dfrac{\text{C}}{\text{total}} \times 100\%\).
Trap
If two bars look the same height, look at the actual numbers. Tests often place bars 1-2 units apart, hoping you eyeball it.
Example
A bar chart shows monthly sales for January (40), February (55), March (50), April (65). What was the average?
\(\dfrac{40 + 55 + 50 + 65}{4} = \dfrac{210}{4} = 52.5\).
Recommended Practice Resources

Line Graphs
Line graphs show change over time. The x-axis is usually time; the y-axis is the measured quantity.
What to read
- The trend: increasing, decreasing, or both.
- The slope: how fast is it changing?
- Peaks and valleys: highest and lowest points.
Typical questions
- “In which year did the value peak?” → Find the highest point.
- “What was the change between two years?” → Subtract.
- “By what percent did the value increase?” → \(\dfrac{\text{new} – \text{old}}{\text{old}} \times 100\%\).
- “If the trend continues, what’s the next value?” → Extrapolate.
Multi-line graphs
When two or more lines are on the same graph, read the legend carefully. Compare the lines: which is higher? Where do they cross?
Example
A line graph shows a company’s revenue: 2022 = \$100K, 2023 = \$130K, 2024 = \$150K. What was the percent increase from 2022 to 2024?
\(\dfrac{150 – 100}{100} \times 100\% = 50\%\).
Pie Charts
Pie charts show parts of a whole. The whole pie is 100%, and each slice is a percent of the total.
What to read
- The percentage of each slice (usually labeled).
- The legend showing what each color represents.
Typical questions
- “Which category is largest?” → Find the biggest slice.
- “What percent is category X?” → Read the label.
- “If the total is \$200, how much is category X?” → $\text{percent} \times \text{total}$.
- “Two categories combined make what percent?” → Add their percents.
Trap
Pie charts always total 100%. If the percents in the slices add to more or less than 100, you’ve misread something — or the chart is wrong.
Example
A pie chart shows a family’s monthly budget: rent 35%, food 20%, transportation 15%, entertainment 10%, savings 20%. If their monthly income is \$4,000, how much do they save?
$0.20 \times 4000 = \$800$.
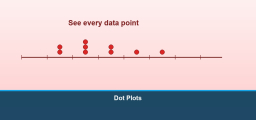
Scatter Plots
Scatter plots show the relationship between two variables. Each dot is one data point.

What to read
- The correlation: is there a pattern as one variable increases?
- Positive: as \(x\) increases, \(y\) increases.
- Negative: as \(x\) increases, \(y\) decreases.
- None: dots scattered randomly.
- Outliers: dots far from the rest.
- Trend line (if shown): the best-fit line through the data.
Typical questions
- “What kind of correlation is shown?”
- “What is the slope of the trend line?”
- “Predict the \(y\)-value when \(x = \) (some value)” → Read off the trend line.
- “Which data point is an outlier?” → The one farthest from the trend.
Example
A scatter plot shows hours studied vs. test score. The trend line passes through (2, 70) and (6, 90). Predict the score for 4 hours studied.
Slope = \(\dfrac{90 – 70}{6 – 2} = \dfrac{20}{4} = 5\) points per hour.
At 4 hours: 70 + 5(2) = 80.
Reading the Axes Carefully
The single most common trap on standardized tests is a mis-scaled axis:
- A y-axis that doesn’t start at 0 makes small changes look huge.
- A y-axis with non-uniform intervals (skipping numbers) hides data.
- A logarithmic scale (each gridline is 10× the previous) makes large differences look small.
Always check what each gridline is worth before answering.
Common Mistakes
Skipping the title
The title tells you what you’re looking at. Without it, you might confuse units, time periods, or categories.
Misreading the scale
“Each gridline is 5” is very different from “each gridline is 50.”
Ignoring the legend
On multi-line or stacked bar graphs, the legend is essential.
Confusing correlation with causation
A scatter plot showing two variables move together does not prove one causes the other.
Rounding too early
On graph questions, read values as precisely as the graph allows. Round only at the end.
Eyeballing instead of reading labels
If a value is labeled on the graph, use the label. Don’t guess.
Free Resources
Effortless Math has a complete data and statistics library:
- Statistics Worksheets — practice graph problems with answers.
- Math Topics Library — every data interpretation topic.
- SAT Math eBooks — data sections covered in depth.
Frequently Asked Questions
Are graph questions on every standardized test?
Yes. SAT, ACT, GRE, GED, TEAS, ASVAB, ACCUPLACER all include data interpretation.
Which graph is easiest?
Bar graphs and pie charts are usually the most straightforward. Scatter plots take the most practice.
What’s the difference between a histogram and a bar graph?
A histogram shows the frequency of numerical ranges (bins). A bar graph compares discrete categories. Histograms have no gaps between bars; bar graphs do.
Can a pie chart have more than 100%?
No — by definition, all slices add to 100%. If they don’t, the chart is wrong.
What’s a “best-fit line”?
The straight line that comes closest to all the points on a scatter plot. It is used to make predictions.
How can I get faster at graph questions?
Practice 10 graph questions a day for a week. Time yourself. The four-step approach becomes automatic.
Read Graphs, Win Test Points
Graph questions are some of the easiest points on any standardized test — if you slow down and read carefully. The math is rarely hard. The mistakes come from rushing. Apply the 4-step framework on every graph, and you’ll never lose another point to a misread label.
Keep Practicing With the Right Resources

Related to This Article
More math articles
- How to Multiply Three or More Numbers?
- Top 10 Tips to Create an ISEE Math Study Plan
- The Ultimate STAAR Algebra 1 Course (+FREE Worksheets)
- How to Find Integers Equivalent Quotients
- Mutations and Genetic Evidence
- 49 Free Grade 5 Math Worksheets for Tennessee TCAP Prep, Built Around the Real Skill List
- Number Properties Puzzle – Challenge 13
- The Best Grade 7 ELA Practice Tests for Indiana Students
- Claim, Reason, and Evidence
- How to Pass the GED Math Test on Your First Try (2026)


What people say about "How to Read and Interpret Graphs: Bar, Line, Pie & Scatter - Effortless Math"?
No one replied yet.