Stem-and-Leaf Plot Maker
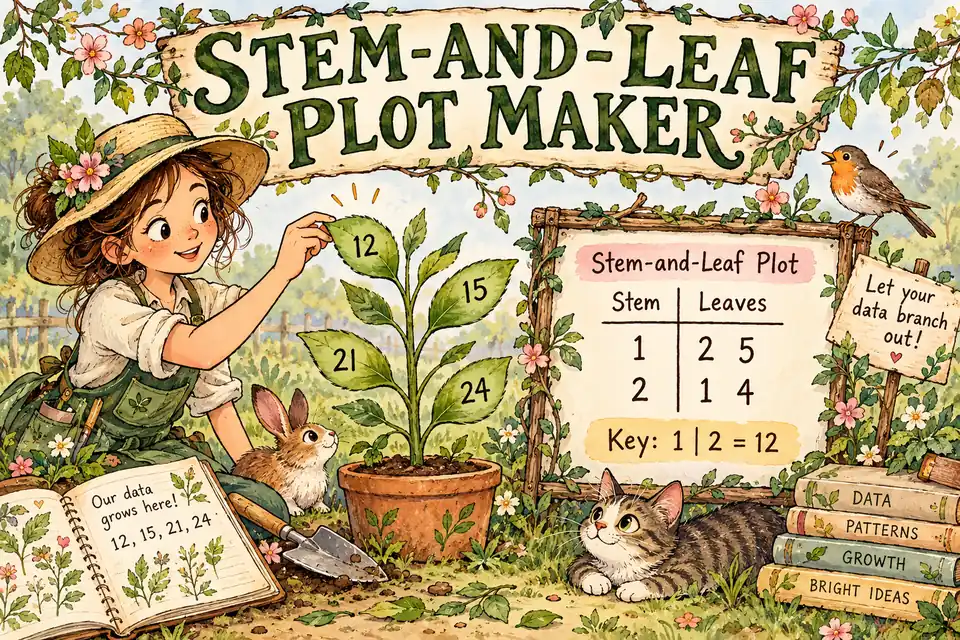
A stem and leaf plot maker sorts your numbers, splits each one into a stem (the leading digits) and a leaf (the last digit), and lays them out in rows with a key. This one works with whole numbers or one-decimal data, can build a back-to-back plot for two data sets, and also finds the mean, median, mode and range with the steps shown.
How to use the Stem-and-Leaf Plot Maker
- Type or paste your data, separated by commas, spaces or line breaks. The order does not matter.
- Leave the stem unit on Automatic, or choose tens/ones for whole numbers or whole number/tenths for data like 4.6.
- To compare two groups, tick Back-to-back plot and enter the second data set and the names of both sets.
- Press Make plot or the Enter key, then read the plot, the key and the statistics.
How to make a stem-and-leaf plot by hand
The method is the same for any data: order the values, split each one into a stem and a leaf, list every stem from smallest to largest, write the leaves in order, and add a key.
Example 1: whole numbers
Data: 23, 41, 35, 28, 47, 35, 52, 31, 44, 35, 26, 49
- Order the data: 23, 26, 28, 31, 35, 35, 35, 41, 44, 47, 49, 52. There are 12 values.
- The stem is the tens digit and the leaf is the ones digit, so 23 becomes 2 | 3.
- The stems run from 2 to 5. Write the leaves in order on each row:
2 | 3 6 8
3 | 1 5 5 5
4 | 1 4 7 9
5 | 2
Key: 2 | 3 = 23 - Mean: the sum is 446, so the mean is 446 ÷ 12 ≈ 37.17.
- Median: with 12 values, average the 6th and 7th values. Both are 35, so the median is 35.
- Mode: the leaf 5 appears three times on stem 3, so the mode is 35.
- Range: 52 − 23 = 29.
Example 2: data with one decimal place
Data (plant heights in cm): 4.6, 5.2, 3.8, 4.1, 5.0, 4.6, 3.5, 4.9, 6.1
- Order: 3.5, 3.8, 4.1, 4.6, 4.6, 4.9, 5.0, 5.2, 6.1. There are 9 values.
- The stem is the whole-number part and the leaf is the tenths digit, so 3.5 becomes 3 | 5.
- The plot:
3 | 5 8
4 | 1 6 6 9
5 | 0 2
6 | 1
Key: 3 | 5 = 3.5 - Mean: the sum is 41.8, so the mean is 41.8 ÷ 9 ≈ 4.64.
- Median: with 9 values, the median is the 5th value, 4.6.
- Mode: 4.6 appears twice, so the mode is 4.6.
- Range: 6.1 − 3.5 = 2.6.
Back-to-back stem-and-leaf plots
To compare two groups, share one column of stems. Team A scored 12, 15, 21, 24 and 28 points; Team B scored 18, 22, 23, 31 and 35. Team A’s leaves go on the left and read outward from the stem, so the row for stem 2 shows 8 4 1 on Team A’s side.
| Team A leaf | Stem | Team B leaf |
|---|---|---|
| 5 2 | 1 | 8 |
| 8 4 1 | 2 | 2 3 |
| 3 | 1 5 |
Key: 2 | 1 | means 12 for Team A, and | 1 | 8 means 18 for Team B. Team B’s leaves sit lower in the plot, so Team B tended to score more: its median is 23, while Team A’s is 21.
Quick reference and common mistakes
| Data type | Stem | Leaf | Example key |
|---|---|---|---|
| Two-digit whole numbers | Tens digit | Ones digit | 3 | 7 = 37 |
| Three-digit whole numbers | Hundreds and tens | Ones digit | 12 | 4 = 124 |
| One decimal place | Whole-number part | Tenths digit | 3 | 7 = 3.7 |
- Leaves with two digits. Each leaf is a single digit. 124 is 12 | 4, not 1 | 24.
- Leaves out of order. Sort them on every row, or the median and mode are hard to read.
- Dropping repeated values. If 35 appears three times, write the leaf 5 three times. Repeats are how you spot the mode.
- Skipping empty stems. A stem with no leaves still gets its own row.
- Uneven spacing. Line the leaves up in columns so the row lengths compare fairly, like bars in a sideways bar graph.
- Forgetting the key. Without it, 3 | 7 could mean 37, 3.7 or 370.
When stem-and-leaf plots are used
Stem-and-leaf plots usually appear in grades 4 to 7 alongside dot plots, frequency tables and histograms, and again in introductory statistics. They suit small to medium data sets, roughly 10 to 50 values. Unlike a histogram, a stem-and-leaf plot keeps every original value, so you can still read off the median, mode and range. Turned on its side, it also shows the shape of the data: where values cluster, where the gaps are, and whether the data is skewed.
For more practice with the statistics, try these mean, median, mode and range problems. To measure spread in other ways, use the standard deviation calculator or the percentile calculator.
Check your answer
Count the leaves in your finished plot. The count must equal the number of values in the original list. Then read the plot back into a list using the key and compare it with your sorted data. If a value is missing or a leaf is out of order, the median and mode will be off as well.
Stem-and-leaf plots practice quiz: 10 questions
Test yourself with 10 multiple-choice questions. Choose an answer and press Submit to see if you are right and why. Your score appears at the end.
The first stem is 2 and its first leaf is 3. With the key 2 | 3 = 23, the smallest value is 23.
The leaf 2 appears twice on stem 3, so 32 is the only value that repeats.
In order: 23, 25, 28, 30, 32, 32, 37, 41, 46, 54. With 10 values the median is the mean of the 5th and 6th: (32 + 32) ÷ 2 = 32.
The sum is 23 + 25 + 28 + 30 + 32 + 32 + 37 + 41 + 46 + 54 = 348. 348 ÷ 10 = 34.8.
The stem is the ones digit and the leaf is the tenths digit, so 7.1 is stem 7 with leaf 1.
Each stem is everything except the last digit: 105 to 109 use stem 10, then 11, 12 and 13 (for 130 to 132).
The same picture 6 | 2 could mean 62, 6.2 or 620. The key says which, so readers get the real values.
Quiz complete
Frequently asked questions
What is the key in a stem-and-leaf plot?
The key is one sample entry that shows what the stem and leaf stand for, such as 3 | 7 = 37 or 3 | 7 = 3.7. The same picture can mean very different numbers, so a plot without a key cannot be read with certainty. Always include one.
How do you find the median from a stem-and-leaf plot?
Count the leaves to get the number of values, n. The leaves are already in order, so count from the first leaf to position (n + 1) ÷ 2. If n is even, average the two middle values. For example, with 12 values, average the 6th and 7th values.
How do you make a stem-and-leaf plot with decimals?
For data with one decimal place, use the whole-number part as the stem and the tenths digit as the leaf, so 4.6 becomes 4 | 6. Add a key such as 4 | 6 = 4.6. If the data has two decimal places, round to tenths first or use a stem that includes the tenths digit.
What do you do if a stem has no leaves?
Keep the stem in the list and leave its leaf side blank. Skipping it would squeeze the plot together and hide the gap in the data, which is one of the things a stem-and-leaf plot is good at showing.
What is a back-to-back stem-and-leaf plot?
It compares two data sets that share one column of stems. One set's leaves go to the right of the stems and the other set's leaves go to the left, written so that they increase as they move away from the stem. It makes it easy to see which group has higher values or more spread.

Related to This Article
More math articles
- Issue networks
- FREE TASC Math Practice Test
- The Best Grade 6 ELA Practice Tests for Hawaii Students
- 7th Grade Math Worksheets for Mississippi (MAAP): 95 Free Printable PDFs
- Pendleton Civil Service Reform Act
- How to Use Exponents to Write down Multiplication Expressions?
- Everything You Need to Pass the GED Math Test
- A Complete Step-by-Step Guide on Euler’s Method
- Introduction to Complex Numbers: Navigating the Realm Beyond the Real
- ACT Calculators: Expert Tips

















What people say about "Stem and Leaf Plot Maker (Back-to-Back, Decimals)"?
No one replied yet.