Probability and Statistics for Beginners: A Friendly Intro

Probability tells you what could happen. Statistics tells you what did happen. Together, they’re how we make decisions with imperfect information, from weather forecasts to medical trials to baseball lineups. Here’s your friendly introduction.
Mean, median, mode, the three measures of center
Given the data set: 4, 7, 7, 9, 13.
- Mean (average): add them up, divide by how many. \((4 + 7 + 7 + 9 + 13) ÷ 5 = 40/5 = 8\).
- Median (middle): sort, find the middle. Sorted: 4, 7, 7, 9, 13 → median = 7.
- Mode (most common): the number that appears most. Mode = 7.
When to use which:
- Mean for symmetric data with no outliers.
- Median for skewed data (income, home prices).
- Mode for categorical data (favorite color).
Range and spread
- Range = max − min. Easy.
- Standard deviation = how far the data spreads from the mean. (Save for later.)
Probability basics
The probability of an event:
\[P(\text{event}) = \dfrac{\text{favorable outcomes}}{\text{total outcomes}}\]
Example: rolling a 4 on a fair die. \(P = \tfrac{1}{6}\).
Example: drawing a red card from a standard deck. \(P = \tfrac{26}{52} = \tfrac{1}{2}\).
Independent vs. Dependent events
- Independent: one doesn’t affect the other. \(P(A \text{ and } B) = P(A) \cdot P(B)\).
Example: flipping heads then rolling a 3. \(P = \tfrac{1}{2} \cdot \tfrac{1}{6} = \tfrac{1}{12}\).
- Dependent: the first changes the odds for the second.
Example: drawing two aces from a deck (without replacing). \(P = \tfrac{4}{52} \cdot \tfrac{3}{51} = \tfrac{12}{2652} = \tfrac{1}{221}\).
“Or” vs. “and”
- “Or” = add (subtract overlap if any).
- “And” = multiply.
Example: rolling a 2 OR a 5? \(\tfrac{1}{6} + \tfrac{1}{6} = \tfrac{1}{3}\).
Common mistakes
- Forgetting that probabilities must be between 0 and 1.
- Treating dependent events as independent.
- Confusing mean with median for skewed data.
FAQ
What’s the difference between probability and statistics?
Probability predicts what could happen; statistics analyzes what did happen.
What’s the easiest way to remember mean, median, mode?
Mean = average. Median = middle (M for Middle). Mode = most common.
When is probability 0 vs. 1?
0 = impossible. 1 = certain. Everything else is in between.
Are probability and stats on the SAT and ACT?
Yes, and they’re growing in weight on both tests.
Extra study tips that move the needle
Most students don’t fail because the math is too hard. They fail because their practice habits are inefficient. Here are the habits that separate the students who improve fast from those who stall.
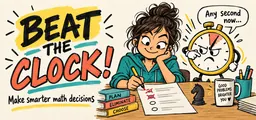
Practice with a timer. Untimed practice teaches you to eventually get the right answer; timed practice teaches you to get it in test conditions. Set a stopwatch every time you sit down. Aim for 90 seconds per question on most standardized tests.
Keep an error log. A simple spreadsheet with three columns, Problem, My answer, Correct answer, Why I missed it, is the single most powerful study tool ever invented. Review your error log weekly. The same mistakes show up again and again until you name them.
Mix topics every session. Doing 20 problems on the same topic feels productive, but spaced and interleaved practice, mixing topics, builds retrieval skills, which is what the test actually measures. Spend 70% of your time on mixed sets and only 30% on isolated drills.
Sleep on it. Memory consolidation happens during sleep. A 30-minute session the night before a quiz, followed by 7+ hours of sleep, beats a 3-hour cram session that ends at midnight. This is settled cognitive science.
Teach the topic out loud. If you can’t explain it, you don’t fully know it. Either record yourself, write a one-paragraph “how I’d teach this” explanation, or grab a friend to listen. Teaching exposes the gaps your problem sets hid.
When to ask for help
Spinning your wheels for more than 15 minutes on a single problem is a signal, not of failure, but of a missing piece of background. Stop, mark the problem, and either ask a teacher, post in our community, or watch a video on the relevant subtopic. Resuming after gaining the missing piece is much more efficient than guessing your way forward.
A quick self-assessment
Before you close this tab, answer these three questions honestly:
- What’s the one topic in this article you understood best?
- What’s the one topic that still feels fuzzy?
- What concrete next step (a worksheet, a practice test, a video) will you take in the next 48 hours?
Writing those answers down, even just in a notes app, has been shown to roughly double the chance you actually follow through. Treat the next 48 hours as a small, doable experiment, not a marathon. Your future test-day self will thank you.
A deeper dive into common questions
The questions students ask after reading an article like this one tend to cluster. Here are the most useful ones, and short, direct answers.
Are probability and statistics the same? No, but they are closely linked. Probability starts with a known situation and predicts what is likely to happen, such as a 1/6 chance of rolling a 4 on a fair die. Statistics starts with data that already happened and describes or explains it, such as finding that the mean of 4, 7, 7, 9 and 13 is 8.
Is probability and statistics easy? The beginner ideas are very approachable, since mean, median, mode and basic probability use only arithmetic and fractions. It gets harder when problems involve dependent events, combinations or standard deviation. The most common trouble spot is knowing when to add and when to multiply: use addition for or with separate outcomes and multiplication for and with independent events.
What is probability and statistics used for? They help people make decisions when outcomes are uncertain. Weather forecasters use probability to give a 70% chance of rain, doctors use statistics to judge whether a treatment works, and sports teams use averages to plan lineups. In daily life, knowing that the median home price is often more useful than the mean, because a few mansions can pull the mean up, helps you read news reports wisely.
How do you learn probability and statistics? Start with measures of center: mean, median and mode. Then learn range, the basic probability formula (favorable outcomes ÷ total outcomes), and the difference between independent and dependent events. Practice with dice, coins and cards, because you can check answers by counting. For example, the chance of drawing two aces in a row without replacement is 4/52 × 3/51 = 1/221.
What are probability and statistics examples? A probability example: the chance of flipping heads and then rolling a 3 is 1/2 × 1/6 = 1/12. A statistics example: test scores of 70, 75, 80, 85 and 140 have a mean of 90 but a median of 80, so the median better describes a typical score because 140 is an outlier. Both kinds of questions often appear together in one class.
How do you get good at probability and statistics? Do a few problems often and always ask whether the answer makes sense. A probability must be between 0 and 1, and an average must fall between the smallest and largest values. Write out the sample space for small problems, such as all 36 outcomes for two dice, so you can see why rolling a sum of 7 has a probability of 6/36 = 1/6.
A short worked example you can copy
Here’s a typical worked example pattern that applies to many problems in this article’s topic:
- Identify the question. What exactly is being asked? Underline it.
- Identify the given information. What numbers and relationships are you handed?
- Pick the relevant formula or rule. From your toolkit, which one connects the given info to the question?
- Plug in carefully. Write each substitution explicitly. Don’t do steps in your head.
- Simplify. Reduce fractions, combine like terms, simplify radicals.
- Verify. Plug your answer back into the original setup. Does it make sense?
This 6-step pattern handles roughly 80% of problems you’ll see in middle-school, high-school, and standardized-test math.
Mini-glossary
A few terms that come up repeatedly in this topic and its neighbors:
- Variable. A letter (often \(x\) or \(y\)) that stands in for an unknown number.
- Coefficient. The number multiplying a variable. In $3x$, the coefficient is 3.
- Expression. A combination of numbers, variables, and operations, without an equals sign. Example: $3x + 5$.
- Equation. Two expressions joined by an equals sign. Example: \(3x + 5 = 14\).
- Inequality. Two expressions joined by $<$, $>$, \(\le\), or \(\ge\).
- Solution. A value (or set of values) of the variable that makes an equation or inequality true.
- Evaluate. Substitute a number for the variable and simplify to a single value.
- Simplify. Rewrite the expression in its cleanest equivalent form.
Internalize this vocabulary. Test questions assume you know it.
Your next 7 days
If this article inspired you to act, here’s a small, doable 7-day plan:
- Day 1. Re-read the worked examples. Try them with the page covered.
- Day 2. Do a 15-minute warm-up of related practice problems.
- Day 3. Take a short timed quiz. Score yourself.
- Day 4. Review your misses. Write one sentence about each.
- Day 5. Do a mixed practice set blending this topic with two others.
- Day 6. Rest, or do a light review.
- Day 7. Take a longer timed practice set and track your progress.
Seven days is enough to feel a real shift. Two or three of those cycles, and the topic moves from “hard” to “easy.”
One last reminder
Progress in math compounds. A 1% improvement every day for 100 days yields nearly a 3x improvement overall, because each new concept builds on the last. The students who pull ahead aren’t the ones who study the longest. They’re the ones who study consistently, review their mistakes, and refuse to skip the foundations. Show up tomorrow. Then show up the day after. The results take care of themselves.
If you found something useful here, save this article and revisit it after your next practice session. You’ll catch nuances on the second read that you missed on the first, because by then you’ll have the experience to recognize them. Happy practicing.
How do I start learning statistics?
Master mean, median, mode, range, and basic probability first. Then add charts, percentiles, and standard deviation.

Related to This Article
More math articles
- Top 10 4th Grade PSSA Math Practice Questions
- CPA FAR Blueprint: What to Recheck in a Course (2027 Prep)
- Limits: What Happens When a Function Approaches Infinity
- THEA Math Flashcards (Free Online: Formulas, Terms & Concepts)
- The Best Grade 8 ELA Practice Tests for Alabama Students
- 7th Grade ACT Aspire Math Worksheets: FREE & Printable
- Civil rights enforcement
- Motor Voter Act
- FREE 5th Grade PARCC Math Practice Test
- 7th Grade Math Worksheets for Missouri (MAP): 95 Free Printable PDFs





What people say about "Probability and Statistics for Beginners"?
No one replied yet.