How to Graph Quadratic Functions?
Graphing quadratic functions is a process of plotting quadratic functions in a coordinate plane. The following guide, help you learn how to graph quadratic functions.

Graphing quadratic functions can be done using both the general form and vertex form.
Related Topics
A step-by-step guide to graphing quadratic functions
Graphing quadratic functions is a technique for graphically studying the nature of quadratic functions. The shape of the parabola (graph of a quadratic function) is determined by the coefficient \(a\) of the quadratic function \(f(x)=ax^2+bx+c\), where \(a, b, c\) are real numbers and \(a ≠ 0\).
The vertex form of a quadratic function is \(f(x)=a(x-h)^2+k\), where \((h, k)\) is the vertex of the parabola. The coefficient determines whether the graph of a quadratic function opens up or down.
Note: The coefficient \(a\) also controls the speed of increase (or decrease) of the graph of the quadratic function from the vertex. A larger and positive \(a\) makes the function increase faster and the graph appears thinner.
Graphing quadratic functions in vertex form
We will study a step-by-step method for plotting each quadratic function. Consider the general quadratic function \(f(x)=ax^2+bx+c\). First, we rearrange it to the following form: \(f(x)=a(x+\frac{b}{2a})^2-\frac{D}{4a}\). The term \(D\) is the discriminant, given by \(D=b^2-4ac\).
Here, the vertex of the parabola is \((h, k) = (-\frac{b}{2a}, -\frac{D}{4a})\). Now, to plot the graph of \(f(x)\), we start by taking the graph of \(x^2\), and applying a series of transformations to it:
Step 1: \(x^2\) to \(ax^2\): This means the vertical scale of the original parabola. If \(a\) is negative, the parabola will also flip its mouth from the positive to the negative side. The magnitude of the scaling depends upon the magnitude of \(a\).
Step 2: \(ax^2\) to \(a(x + \frac{b}{2a})^2\): This is a horizontal shift of magnitude \(|\frac{b}{2a}|\) units. The direction of the shift will be decided by the sign of \(\frac{b}{2a}\). The new vertex of the parabola will be at \((-\frac{b}{2a},0)\). The following figure shows an example shift:
Step 3: \(a(x + \frac{b}{2a})^2\) to \(a(x + \frac{b}{2a})^2 – \frac{D}{4a}\): This transformation is a vertical shift of magnitude \( |\frac{D}{4a}|\) units. The direction of the shift will be decided by the sign of \(\frac{D}{4a}\). The final vertex of the parabola will be at \((-\frac{b}{2a}, -\frac{D}{4a})\). The following figure shows an example shift:
Graphing quadratic functions in standard form
The general equation of a quadratic function is \(f(x) = ax^2+bx + c\). To plot the quadratic functions using the standard form of the function, we can convert the general form to the vertex form and then plot the quadratic function diagram or determine the axis of symmetry and y-intercept of the graph and plot it.
Exercises for Graphing Quadratic Functions
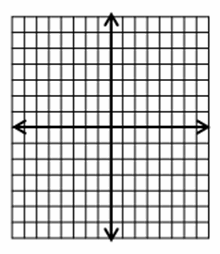
Sketch the graph of each function.
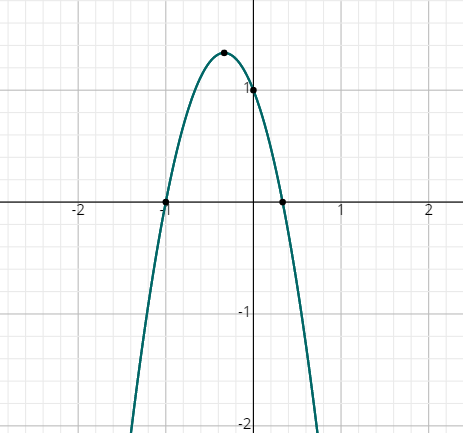
- \(\color{blue}{f\left(x\right)=1-2x-3x^2}\)

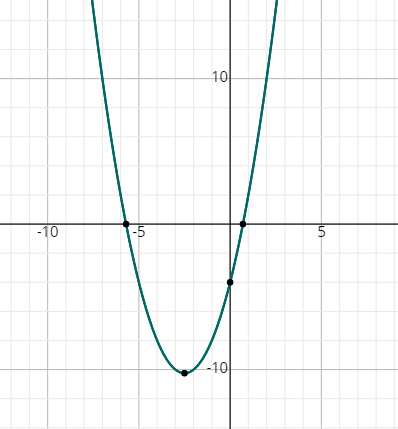
- \(\color{blue}{f\left(x\right)=x^2+5x-4}\)


- \(\color{blue}{f\left(x\right)=x^2+5x-4}\)

Related to This Article
More math articles
- 7 Best Digital Pen Tablets for Online Math Teaching in 2024
- 3rd Grade New York State Assessments Math Worksheets: FREE & Printable
- A Comprehensive Collection of Free HiSET Practice Tests
- A Deep Dive Into The World of Vector-Valued Function
- FREE 7th Grade Georgia Milestones Assessment System Math Practice Test
- Best Calculators fоr Algеbrа
- A Comprehensive Collection of Free GED Math Practice Tests
- Reading Clocks
- The Ultimate GRE Math Course: The Only Course You Need for Success
- The Ultimate TABE Math Formula Cheat Sheet


What people say about "How to Graph Quadratic Functions? - Effortless Math: We Help Students Learn to LOVE Mathematics"?
No one replied yet.