How to Graph the Sine Function?
The sine of an angle is a trigonometric function, which is also called the sine function. This step-by-step guide teaches you how to graph the sine function.

A step-by-step guide to graph the sine function
The sine of an angle can be defined as the ratio of the length of the perpendicular to the length of the hypotenuse in a right triangle. The value of the sine function shows the angle between the base and the hypotenuse of a right triangle.
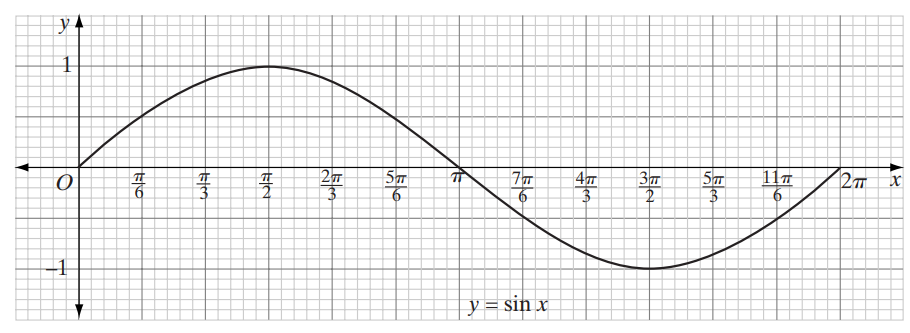
To graph the sine function, we plot a portion of the graph using the subset of real numbers in the interval \(0\le x\:\le \:2\pi\). We know that:

Now, we plot the points whose coordinates are given in the table.

We can see how \(x\) and \(y\) change by using the graph:
- By increasing \(x\) from \(0\) to \(\frac{\pi }{2}\), \(y\) increases from \(0\) to \(1\).
- By increasing \(x\) from \(\frac{\pi }{2}\) to \(\pi\), \(y\) decreases from \(1\) to \(0\).
- By increasing \(x\) from \(\pi\) to \(\frac{3\pi }{2}\), \(y\) continues to decrease from \(0\) to \(-1\).
- By increasing \(x\) from \(\frac{3\pi}{2}\) to \(2\pi\), \(y\) increases from \(-1\) to \(0\).
This pattern repeats itself when we plot a larger subset of the domain of the \(sine\) function. For example, add to the points given above the point whose \(x\)-coordinates are in the interval \(-2\pi \le x\le \:0\):


Related to This Article
More math articles
- How to Use the Distributive Property? (+FREE Worksheet!)
- SHSAT Math Formulas
- How to Apply Trigonometry to General Triangles?
- Measurements – Time
- Best Graphing Calculators for Precalculus
- How to Solve Venn Diagrams and the Addition Rule?
- 5th Grade FSA Math Practice Test Questions
- 3rd Grade STAAR Math FREE Sample Practice Questions
- Top 10 6th Grade Georgia Milestones Assessment System Math Practice Questions
- 3rd Grade KAP Math Worksheets: FREE & Printable


What people say about "How to Graph the Sine Function? - Effortless Math: We Help Students Learn to LOVE Mathematics"?
No one replied yet.