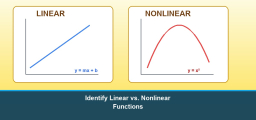
How to Graph Trigonometric Functions?
We can plot diagrams of different trigonometric functions with a range of their principal values. Learn how to plot diagrams of trigonometric functions by the following step-by-step guide.
Trigonometric functions are the basic six functions that have a domain input value as an angle of a right triangle, and a numeric answer as the range. The trigonometric function is also called the trig function.
Related Topics
- How to Evaluate Trigonometric Function
- How to Solve Angles and Angle Measure
- How to Graph Inverse Trigonometric Functions
A step-by-step guide to trigonometric functions graph
Graphs of trigonometric functions have the domain value of \(θ\) shown on the horizontal \(x\)-axis and the range value along the vertical \(y\)-axis.
The graphs of \(sin\:\theta\) and \(tan\:\theta\) pass through the origin and the graphs of other trigonometric functions do not pass through the origin.
The range of \(sin\:\theta\) and \(cos\:\theta\) is limited to \([-1, 1]\). The range of infinite values is presented as drawn beside the dotted lines.


Related to This Article
More math articles
- FREE SIFT Math Practice Test
- 4th Grade STAAR Math Worksheets: FREE & Printable
- ALEKS Math Practice Test Questions
- Top 10 Tips to Create the TExES Core Subjects Math Study Plan
- Ben Stokes – strategist and all-rounder for the English cricket team
- The Math Behind Fair Play: Exploring Random Number Generators and Statistical Testing
- How to Compare and Order Rational Numbers?
- Why Live Online Casinos Are So Popular: Essential Facts to Know
- TABE Math Formulas
- SHSAT Math Formulas


What people say about "How to Graph Trigonometric Functions? - Effortless Math: We Help Students Learn to LOVE Mathematics"?
No one replied yet.