How to Graph Exponential Functions?
An exponential function is a Mathematical function in form \(f(x)=a^x\). We can plot diagrams of the exponential function. Learn how to plot exponential function by the following step-by-step guide.

Graph Exponential Functions: what to notice and how to work it
What to notice first
Common student mistake
Key formulas and cues
A reliable path
- Find the startLook for the value when x or time is 0.
- Find the multiplierUse the base or percent change to identify b.
- Check the shapeGrowth rises away from the asymptote; decay moves toward it.
Worked examples
Growth model
- Start at 100.
- Multiply by 2 three times.
- Compute 100 times 8.
Decay model
- Half of 80 is 40.
- Half of 40 is 20.
- This is multiplying by 1/2 twice.
Try one before moving on
Graph Exponential Functions: pop-up practice
In mathematics, an exponential function is a function of form \(f(x)=a^x\), Where \(x\) is a variable and \(a\) is a constant called the base of the function and must be greater than \(0\).
Related Topics
A step-by-step guide to an exponential function graph
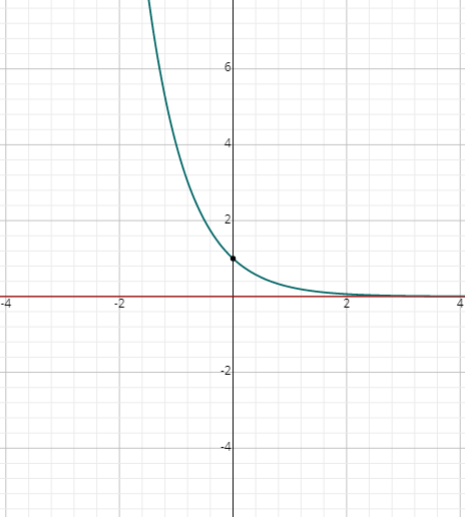
We can understand the process of graphing exponential functions with examples. Let us graph two functions \(f(x)=2^x\) and \(g(x)=(\frac{1}{2})^2\).
To plot \(f(x)=2^x\) function, we create a table of values with random values \(x\), plot the points on the chart, connect them by a curve, and extend the curve on both sides.
Here is the table of values that are used to graph the exponential function \(f(x)=2^x\).
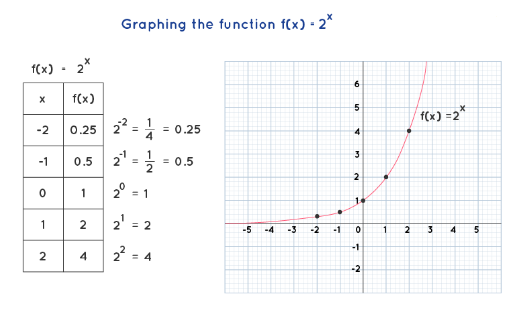
Note: the graph of exponential function \(f(x)=b^x\):
- increases when \(b > 1\)
- decreases when \(0 < b < 1\)
Domain and Range of Exponential Function
The domain of a function \(y = f (x)\) is the set of all values of \(x\) (inputs) that can be calculated, and the range is the set of all \(y\)-values (outputs) of the function.
The domain of an exponential function is the set of all real numbers (or) \((-∞, ∞)\).
The range of an exponential function can be determined by the horizontal asymptote of the graph, for example, \(y = d\), and by seeing whether the graph is above \(y = d\) or below \(y = d\).
Therefore, for an exponential function \(f(x) = ab^x\),
- The domain is the set of all real numbers (or) \((-∞, ∞)\).
- Range is \(f(x) > d\) if \(a > 0\) and \(f(x) < d\) if \(a < 0\).
Exercises for Exponential Function Graph
Plot the following exponential functions.
- \(\color{blue}{y=2^x+1}\)
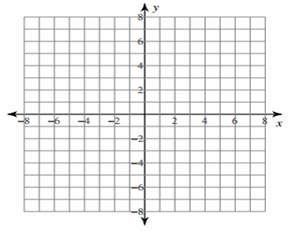
- \(\color{blue}{y=4^{-x}}\)

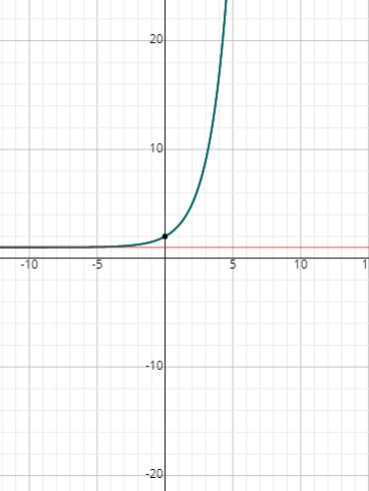
- \(\color{blue}{y=2^x+1}\)
- \(\color{blue}{y=4^{-x}}\)

Related to This Article
More math articles
- Understanding Decimals for 5th Grade: Place Value and Meaning
- How to Determine If (x, y) Is a Solution to a System of Equations
- Rhode Island Grade 2 Math Worksheets — Free Printable PDFs
- Tips You MUST Know to Retake the Praxis Core Math Test
- How Smart Bettors Use Math to Beat the Books
- How to Solve and Graph One-Step Inequalities with Rational Numbers?
- How to Unravel the Mysteries of Infinite Limits
- How to Add and Subtract Polynomials? (+FREE Worksheet!)
- FREE 8th Grade MEAP Math Practice Test
- Media, Technology, and Digital Life


What people say about "How to Graph Exponential Functions"?
No one replied yet.