How to Identify Graphs of Basic Functions
A graph of a function is a visual representation of the relationship between the inputs and outputs of that function. It’s depicted on a coordinate system, commonly referred to as the Cartesian plane, which consists of two perpendicular number lines: the \(x\)-axis (horizontal) and the \(y\)-axis (vertical).

Step-by-Step Guide to Identify Graphs of Basic Functions
Here is a step-by-step guide to identifying graphs of basic functions:
Step 1: Lay the Foundation:
- Familiarize yourself with the definitions and typical appearances of basic functions such as linear, quadratic, cubic, exponential, logarithmic, trigonometric, and more.
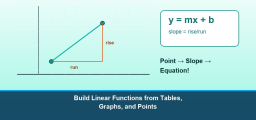
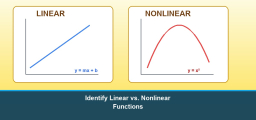
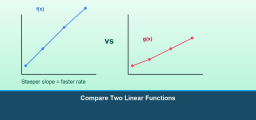
Step 2: Linear Functions \(f(x)=mx+b\)
- Observe a straight line.
- The slope \(m\) indicates steepness and direction (positive slope: rising, negative slope: falling).
- The y-intercept \(b\) is where the line crosses the \(y\)-axis.
Step 3: Quadratic Functions \(f(x)=ax^2+bx+c\)
- Recognize a parabolic shape.
- The direction (opening upwards or downwards) depends on the sign of \(a\).
- Vertex and axis of symmetry can provide added clues.
Step 4: Cubic Functions \(f(x)=ax^3+bx^2+cx+d\)
- Look for an “\(S\)”-shaped curve or a curve resembling a line depending on leading and other coefficients.
Step 5: Exponential Functions \(f(x)=a^x\)
- Notice a rapid increase or decrease.
- Passes through the point \((0,1)\) for base \(a>1\).
- For \(0<a<1\), it’s a decreasing function.
Step 6: Logarithmic Functions \(f(x)=log_a\left(x\right)\)
- The inverse of the exponential function.
- Contains a vertical asymptote at \(x=0\).
Step 7: Trigonometric Functions (e.g.,\(f(x)=sin(x)\))
- Periodic oscillations.
- Regular peaks and troughs.
Step 8: Rational Functions \(f(x)=\frac{p(x)}{q(x)}\)
- Ratios of polynomials.
- Look for vertical asymptotes where the denominator equals zero and horizontal asymptotes that indicate the function’s behavior at extremes.
Step 9: Absolute Value Function \(f(x)=∣x∣\)
- \(V\)-shaped graph.
- Pointed vertex where the graph changes direction.
Step 10: Gauge Symmetry and Patterns
- Even functions (like \(f(x)=x^2\)) show \(y\)-axis symmetry.
- Odd functions (like \(f(x)=x^3\)) possess origin symmetry.
Step 11: Identify Transformations
- Shifts, stretches, compressions, and reflections can modify the basic shape of functions. Recognizing the base function will aid in identification.
Step 12: Analyze Intercepts and Asymptotes
- \(x\) and \(y\) intercepts can provide hints.
- Asymptotes (horizontal, vertical, or oblique) can give insights, especially for rational, logarithmic, and some trigonometric functions.
Step 13: Use Technology for Complex Graphs
- Graphing calculators or software tools like Desmos and GeoGebra can visualize and confirm function types.
Step 14: Practice, Practice, Practice
- Continuously challenge yourself with diverse graph types. Over time, pattern recognition will become more intuitive.
Step 15: Engage in Collaborative Analysis
- Discuss with peers, share observations, and solve challenges collectively. Different perspectives can enrich understanding.
By following this comprehensive guide, learners can progressively cultivate the ability to swiftly and accurately identify a wide range of basic function graphs, even when these graphs are presented with high variation and intricate nuances.

Related to This Article
More math articles
- The Best Grade 7 Math Book for Vermont Students
- The Best Grade 3 ELA Practice Tests for Mississippi Students
- Why So Many Students Struggle with Math Anxiety and How to Deal with It
- Splitting Pairs: Eight Decisions Where Math Disagrees With Intuition
- Baccarat Scoreboards: What the Big Eye Road Actually Tracks
- Building Strong Body Paragraphs
- Point-Slope Form Worksheet with Answers
- Algebra Puzzle – Challenge 47
- The Best Grade 7 ELA Practice Tests for Wisconsin Students
- Missouri Algebra 1 Free Worksheets: Printable Practice for Every Algebra 1 Topic


What people say about "How to Identify Graphs of Basic Functions - Effortless Math"?
No one replied yet.