Coordinate Planes as Maps
When we say "coordinate planes as maps," we are referring to using a coordinate plane (a two-dimensional Cartesian coordinate system with X and Y axes) to represent the location of objects or navigate to different areas, much like how we use maps to find locations in the real world.

A step-by-step guide to coordinate planes as maps
A graph has 4 quadrants since the quadrants are the area enclosed by the \(x\) and \(y\) axes.
The \(2-\)dimensional Cartesian plane gets divided by the \(x\) and \(y\) axes into 4 quadrants.
The origin is a point where perpendicular lines overlap one another. This point is at 0. It’s used to express the location of different places on the earth’s surface.
Here’s a step-by-step guide to using a coordinate plane as a map:
- Understand the coordinate system: The first step to using a coordinate plane as a map is to understand the coordinate system being used. In most cases, a coordinate plane is a two-dimensional Cartesian coordinate system that uses the X and Y axes to define the location of objects on a flat surface. The X-axis represents the horizontal direction, and the Y-axis represents the vertical direction. Each point on the plane is identified by a set of coordinates (X, Y).
- Determine the scale of the map: Once you understand the coordinate system, you need to determine the scale of the map. This will help you understand the relationship between the distances on the map and the actual distances on the ground. For example, if the scale is 1 inch = 1 mile, then 1 inch on the map represents 1 mile on the ground.
- Label the axes: Next, label the X and Y axes of the coordinate plane with the appropriate units of measurement. For example, if the map is using a scale of 1 inch = 1 mile, you can label the X-axis with “Miles East” and the Y-axis with “Miles North”.
- Plot points: Now that the coordinate plane is labeled, you can plot points on the map. To plot a point, simply locate the correct X and Y coordinates and mark the point with a dot or other symbol. If you’re working with a pre-existing data set, you may need to plot multiple points to represent different objects or locations.
- Connect points: If you want to show a path or route on the map, you can connect the points with lines. To do this, simply draw a line between the dots representing the points in the order they are visited.
- Add a legend: Finally, you can add a legend to the map to help others understand what the symbols and lines represent. The legend can include a key to the symbols used to represent different objects or locations, as well as a key to the colors or line styles used to represent different types of data.
By following these steps, you can use a coordinate plane as a map and plot points, lines, and other features to represent data or navigate to different locations.
Objects on a Coordinate Plane – Examples 1,2
Coordinate Planes as Maps – Examples 1, 2
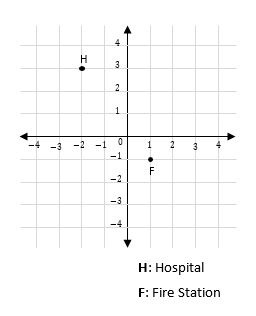
Write the coordinates of the specified points.
1) Where is the hospital?
Solution:
Step 1: Find the point of the hospital on the map. Discover, the \(x\) and \(y-\)coordinates of the hospital point.
\(x-\)coordinates of H: \(-2\)
\(y-\)coordinates of H: 3
Step 2: Write the answer as an ordered pair.
So, the hospital is at \((-2? 3)\).
2) Where is the fire station?
Solution:
Step 1: Find the point of the fire station on the map. Discover, the \(x\) and \(y-\)coordinates of the fire station point.
\(x-\)coordinates of F: 1
\(y-\)coordinates of F: \(-1\)
Step 2: Write the answer as an ordered pair. So, the fire station is at \((1? -1)\).

Related to This Article
More math articles
- CLEP College Math Practice Test Questions
- How much does the CBEST Test Cost?
- FREE CLEP College Algebra Practice Test
- How to Find the Volume and Surface Area of Rectangular Prisms? (+FREE Worksheet!)
- Top 5 Free Websites for ASTB-E Math Preparation
- Full-Length 7th Grade ACT Aspire Math Practice Test
- FREE 5th Grade Georgia Milestones Assessment System Math Practice Test
- How to Find Composite Numbers?
- FREE 4th Grade NYSE Math Practice Test
- How to Prepare for the ParaPro Math Test?


What people say about "Coordinate Planes as Maps - Effortless Math: We Help Students Learn to LOVE Mathematics"?
No one replied yet.