How to Show the Relation in the Coordinate Plane
Showing a relation in the coordinate plane usually means graphing a set of ordered pairs or an equation. The coordinate plane, commonly known as the Cartesian plane, is a two-dimensional surface consisting of the \(x\)-axis and the \(y\)-axis.

Step-by-step Guide to How to Show the Relation in the Coordinate Plane.
Here is a step-by-step guide to how to show the relation in the coordinate plane.:
Step 1: Understand the Basics
- Coordinate Plane (or Cartesian Plane): This consists of two perpendicular number lines, called axes. The horizontal axis is called the \(x\)-axis, and the vertical axis is the \(y\)-axis. The point where they intersect is called the origin, represented as \((0,0)\).
- Ordered Pair \((x, y)\): Represents a point on the coordinate plane. The first number \((x)\) represents the horizontal position (left or right of the origin), and the second number \((y)\) represents the vertical position (above or below the origin).
Step 2: Prepare Your Materials
- Graph paper or a graphing tool/software (e.g., Desmos, GeoGebra).
- Pencil or pen.
- Ruler (helpful for drawing straight lines or connecting points).
Step 3: Plot Individual Points (If Dealing with Ordered Pairs)
- Find the \(x\)-coordinate on the \(x\)-axis.
- From that point, move vertically up (for positive \(y\)-values) or down (for negative \(y\)-values) to reach the \(y\)-coordinate.
- Mark the point where you’ve landed. This is the location of the ordered pair \((x, y)\).
Step 4: If Dealing with an Equation, Determine Your Points
- For a line, choose at least two \(x\)-values and solve for the corresponding \(y\)-values.
- For curves, you might want more points to capture the shape accurately.
Step 5: Draw the Graph
- If you’re plotting individual points (and not connecting them), just mark the points clearly.
- If you’re plotting a continuous relation (like a line or curve), connect the points smoothly. Using a ruler can help with straight lines.
Step 6: Label Your Graph:
- Indicate the scale on both the \(x\) and y axes. (E.g., every square is worth \(1\) unit, \(5\) units, \(10\) units, etc.)
- Label specific points of interest, especially if they represent important values or intersections.
- If you’re graphing an equation, write the equation on or near the graph for reference.
Step 7: Analyze the Relation (Optional)
- Determine if it’s a function (every \(x\)-value has only one corresponding \(y\)-value).
- Identify any patterns or key features such as intercepts, maxima, minima, symmetry, etc.
Step 8: Double-check Your Work:
- Ensure that you’ve plotted all points accurately.
- If using an equation, check a few points to ensure they satisfy the equation.
And that’s it! With these steps, you can show almost any relation on the coordinate plane. Remember, with more complex relations (like parabolas, hyperbolas, etc.), additional techniques and tools might be helpful, but the fundamental approach remains the same.
Example:
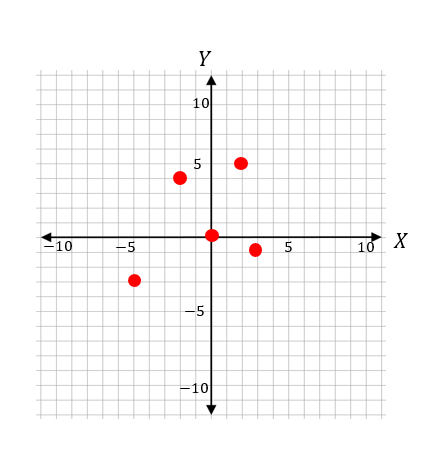
Given the set of ordered pairs of \(S\), represent the following relation on the coordinate plane.
\(S=\){\((2,5), (3,-1), (-2,4), (0,0), (-5,-3)\)}
Solution:
To graph this relation, plot the points \((2,5), (3,-1), (-2,4), (0,0)\), and \((-5,-3)\) on the coordinate plane.

Related to This Article
More math articles
- Top 10 Tips to ACE the ACT Mathematics
- How to Pay for College: Understanding College Payments
- Overview of the ALEKS Mathematics Test
- Geometry Puzzle – Challenge 59
- 6th Grade DCAS Math Worksheets: FREE & Printable
- 4th Grade SBAC Math FREE Sample Practice Questions
- 5th Grade STAAR Math Worksheets: FREE & Printable
- Intelligent Math Puzzle – Challenge 92
- Top 10 Tips to Create the SAT Math Study Plan
- How to Manage Your Time Effectively on the GED Math Test?


What people say about "How to Show the Relation in the Coordinate Plane - Effortless Math: We Help Students Learn to LOVE Mathematics"?
No one replied yet.