Praxis 8005 Earth Science: Explain the Pattern From Data (2027 Prep)
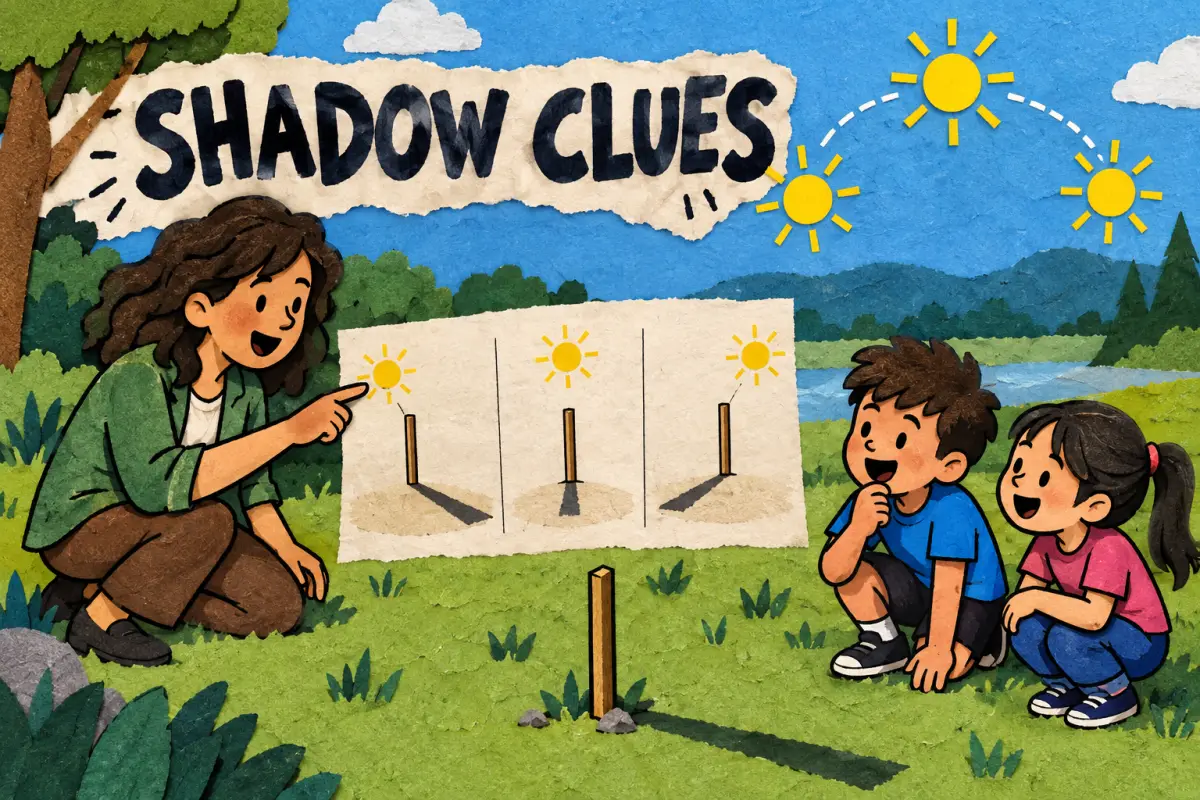
A student measures the shadow of the same upright pole three times. It is long in the morning, short near midday, then long again in the afternoon. What does that pattern let you say? Start with the measurements. Then say only what they support.
This is an original, unofficial Praxis 8005 practice lesson. We will read a small shadow log, match a claim to its evidence, and work through four new questions. None are ETS test questions.
Where Earth and space data fit in Praxis 8005
ETS lists Elementary Education Fundamentals: Science (8005) as a computer-delivered test with 74 selected-response questions and a 90-minute testing period. The content covers Earth and Space Sciences, Life Sciences, and Physical Sciences. ETS says about 10–15% of questions integrate science knowledge with a Science and Engineering Practice, and about 10–15% place science in a teaching scenario or instructional task. Those are blueprint estimates, not a promise that a particular topic or question will appear. The official outline is the place to confirm current details. ETS 8005 overview.
ETS currently offers Praxis Steps for 8002–8005. To schedule an individual Step, ETS directs candidates to their State Requirements page. Check that your state accepts 8005 and which Step or full-test route applies before registering. ETS current test page.
For 8005, a data question may ask you to find a relationship, judge a claim, or decide what observation would make an investigation stronger. The Next Generation Science Standards give a useful elementary example: students graph changes in shadow length and direction, day and night, and the seasonal appearance of stars. The standard also sets a boundary. It does not ask students to explain the causes of seasons. NGSS 5-ESS1-2.
Read the log before you explain it
Imagine a class places one straight pole on level ground and marks its shadow at three points in one clear day. The numbers below are invented for practice. They are a simplified classroom data set, not an official ETS example and not a record from a named city.
|
Time observed |
Shadow length |
|---|---|
|
9:00 a.m. |
118 cm |
|
Near local solar noon |
42 cm |
|
3:00 p.m. |
114 cm |
Read across first. The pole and measuring method stay the same, so the class can compare lengths. Then read down. The shadow is much shorter near local solar noon than in the morning or afternoon. In this set, the morning and afternoon lengths are also close, though the small difference does not prove they are equal.
The careful pattern statement is: In these observations, the shadow length decreased toward local solar noon and increased afterward. That sentence names the trend and its limits. It does not claim every day has the same readings, or that three measurements describe a whole year.
Time goes across. Shadow length, measured in centimeters, goes up the side. Label both axes, use equal intervals, and include zero unless there is a clear reason to use a different scale. A broken or tightly cropped vertical scale can make a small change look dramatic. With only three points, a line between them is a guide to the pattern, not a record of every moment between measurements.
What changes, and what should stay steady?
Keep the setup steady. Use one pole, the same patch of level ground, and one measuring method each time. Record the time and anything that could muddy the reading, such as cloud cover or a marker someone moved. A leaning pole changes the geometry. So does sloped ground. The measured line can shift even if the Sun’s apparent position follows the same daily path, so a student could explain a setup change as an Earth-and-space pattern.
The shadow’s direction matters too. It falls away from the light source. Across a day, the direction and length shift as the Sun appears to move across the sky. From one fixed day’s log, you can describe that day’s pattern. You cannot use it alone to claim how daylight changes from winter to summer, or what the exact pattern will be at another latitude.
A four-step way to read a data question
- Check the setup. What was measured? Was the same object, place, tool, and method used?
- Compare values. Find what rises, falls, repeats, or stays similar. Do not round away a difference before you look at it.
- Match claim to evidence. Choose the strongest statement supported by the table or graph. Reject claims that explain more than the data show.
- Name the next useful observation. If two claims remain possible, ask what additional measurement would separate them.
This routine works for shadow logs, moon observations, local weather records, and many classroom investigations. It also helps you spot a common distractor: a choice can contain a true science fact and still fail to answer what the data show.
Four original Praxis-style questions
These examples are written for practice. ETS has not supplied or endorsed them.
Question 1. A class records the pole’s shadow at 9:00 a.m., near local solar noon, and 3:00 p.m. The lengths are 118 cm, 42 cm, and 114 cm. Which claim is best supported?
Answer: A. It states exactly what the three values show. B turns two similar measurements into a rule for every day. C reaches far beyond one day’s shadow log and confuses a daily pattern with a seasonal explanation. D invents a change in the pole when the measured quantity was the shadow.
Question 2. A student graphs the same three values but starts the vertical axis at 40 cm and labels it “shadow size.” What is the most useful correction?
Answer: B. Units tell readers what the numbers mean. A truncated axis can be useful, but a clear break and explanation keep readers from mistaking the display for a zero-based scale. A removes information. C replaces evidence with a guess. D reverses the usual graph layout and adds an unsupported cause claim.
Question 3. The morning shadow is longer than the afternoon shadow. A student says, “The Sun was lower at 9:00 a.m. than at 3:00 p.m.” Which next step would best test whether that explanation fits the observations?
Answer: A. Repeated observations of the same setup show whether the pattern holds across times and days. B collects opinions instead of measurements. C changes the object and time together, so the results are hard to compare. D stops before the class can judge variation.
Question 4. In a separate scenario, a class records only three shadow readings during one cloudy afternoon. Which additional data would best help the class study how shadow patterns vary by season?
Answer: A. A longer time series can reveal a yearly pattern, provided the class keeps its method and observation conditions clear. B is still one extra day. C does not measure the question. D removes the time information needed to interpret the change.
Why the answer choices can feel close
A strong distractor often borrows one reasonable idea and applies it in the wrong place. “The Sun appears to move across the sky” is a sound description, but it does not make every claim about seasons correct. “The two end measurements are close” is visible in this data set, but closeness is not proof of exact equality or a universal rule.
When you are unsure, point to the evidence that would have to be true for the answer to work. If the table contains no year-long observations, cross out a claim about every season. If the setup changed both pole height and observation time, you cannot tell which change mattered. The best choice usually fits the scope of the evidence, not the biggest science explanation you remember.
Keep the science explanation at the right scale
The NGSS elementary example asks students to use graphs to reveal relationships in daily shadow and sky observations. It identifies repeated observations and data displays as useful tools. For this practice lesson, the observations can support a daily pattern. They cannot by themselves settle every question about Earth’s motions, seasonal daylight, or local climate.
That distinction is useful in a teaching scenario. A teacher can ask, “Which measurements support your claim?” before supplying an explanation. Then students can mark what they know, what they infer, and what they still need to measure. The data stay in charge.
A quick review before test day
Remember the short version: keep the setup comparable, put units on the axes, describe the pattern you can see, then stop before the evidence runs out. Earth and space science often asks you to connect a repeated observation with a cautious explanation. Practice saying the evidence aloud in one sentence before you choose an answer.
Praxis 8005 also covers life and physical science. This lesson handles one Earth-and-space data skill, not the full test. Use the Praxis Elementary Science study hub for the broader topic map and additional practice.
Sources and scope
- ETS, Elementary Education Fundamentals: Science (8005). Current test description, question format, and Science and Engineering Practices/teaching-application estimates. https://praxis.ets.org/test/elementary-education-fundamentals-science-8005.html
- Next Generation Science Standards, 5-ESS1-2 Earth’s Place in the Universe. Data-display expectation, shadow/daylight/star patterns, and assessment boundary. https://www.nextgenscience.org/pe/5-ess1-2-earths-place-universe
- NASA Science, Climate and Earth’s Energy Budget. Background illustration and explanation connecting the Sun’s apparent position to shadow length through a day. https://science.nasa.gov/earth/earth-observatory/climate-and-earths-energy-budget/
The table values and four multiple-choice questions in this article are original practice material. They are not official ETS items. Standards describe learning expectations; they do not predict the exact content of a Praxis form.

Related to This Article
More math articles
- Converting Metric Units for 5th Grade: Length, Mass, Capacity
- Free Grade 3 English Worksheets for Maine Students
- Riemann Sums Made Easy: Step-by-Step Tutorial
- How to Get a GED Certificate?
- Place Value for 5th Grade: Master the Foundation of Numbers with Confidence
- Free New Jersey Grade 2 Math Worksheets
- ACCUPLACER Math Practice Test Questions
- Full-Length 7th Grade GMAS Math Practice Test
- Agency capture
- Free Grade 5 English Worksheets for Colorado Students














What people say about "Praxis 8005 Earth Science: Explain the Pattern From Data (2027 Prep) - Effortless Math"?
No one replied yet.