How to Interpret Pie Graphs? (+FREE Worksheet!)
Pie graphs represent data in a circle. Here, you can learn how to read or use pie graphs or circle charts. For education statistics and research National Center for Education Statistics.
Watch this practice video for additional examples and reinforcement:
Related Topics
- How to Interpret Histogram
- How to Solve Probability Problems
- How to Solve Permutations and Combinations
- How to Find Mean, Median, Mode, and Range of the Given Data
Step-by-step guide to solving Pie Graph problems
- A Pie Chart is a circle chart divided into sectors, each sector represents the relative size of each value.
- To solve problems related to pie graphs, first, categorize your Data, find the Total, and find the value for each category or sector.
The Absolute Best Books to Ace Pre-Algebra to Algebra II
Pie Graph – Example 1:
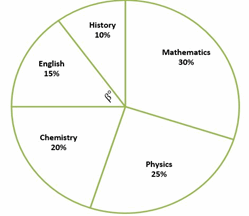
A library has \(670\) books that include Mathematics, Physics, Chemistry, English, and History. Use the following graph to answer the question. What is the number of Mathematics books?

Solution:
Number of total books \(=670 \)
Percent of Mathematics books \(=30\%=0.30\)
Then: \(0.30×670=201\)
Pie Graph – Example 2:
A library has \(840\) books that include Mathematics, Physics, Chemistry, English, and History. Use the following graph to answer the question. What is the number of Mathematics books?
Solution:
Number of total books \(=840 \)
Percent of Mathematics books \(=30\%=0.30\)
Then: \(0.30×840=252\)
Exercises for Solving Pie Graph
The Best Book to Help You Ace Pre-Algebra
Answer the following questions based on the Pie graph.
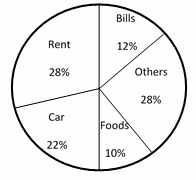
Jason spent \($2,500\) last month.
- How much did Jason spend on his car last month?
- How much did Jason spend on food last month?
- How much did Jason spend on his rent last month?
- What fraction is Jason’s expenses for his bills and car out of his total expenses last month?
Download the Pie Graph Worksheet

- \(\color{blue}{$550}\)
- \(\color{blue}{$250}\)
- \(\color{blue}{$700}\)
- \(\color{blue}{\frac{17}{50}}\)
The Greatest Books for Students to Ace the Algebra

Related to This Article
More math articles
- Top Calculators for the GED 2026: Quick Review
- Free SBAC Grade 5 Math Worksheets: 49 Printable Smarter Balanced–Style Practice PDFs with Answer Keys
- Convert Units of Measurement
- How to Support Grade 5 Reading at Home: 12 Smart Strategies That Build Independence
- Top 10 7th Grade Common Core Math Practice Questions
- Unit Prices with Decimals and Fractions
- The Ultimate 6th Grade ISASP Math Course (+FREE Worksheets)
- CHSPE Math Practice Test Questions
- The Ultimate 6th Grade SBAC Math Course (+FREE Worksheets)
- Free Grade 8 English Worksheets for New Mexico Students


What people say about "How to Interpret Pie Graphs? (+FREE Worksheet!) - Effortless Math: We Help Students Learn to LOVE Mathematics"?
No one replied yet.