How to Graph the Tangent Function?
The tangent function is one of the basic trigonometric functions. In this post, you will learn more about the tangent function and graph it.

Step-by-step guide to graphing the tangent function
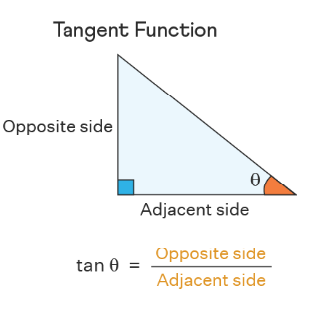
The tangent function is one of the six main trigonometric functions and is generally written as \(tan x\). It is the ratio of the opposite side and the adjacent side of the given angle in a right triangle.

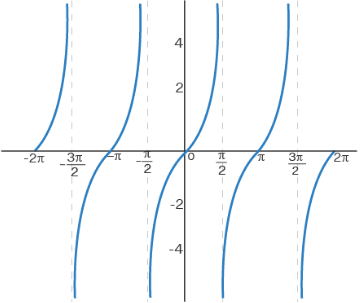
The graph of the \(tan\) function is a discontinuous graph because \(tan x\) is not defined at odd multiples of \(\frac{π}{2}\), that is, \(tan x\) is not defined for \(x = \frac{kπ}{2}\), where \(k\) is an odd integer. Also, since the \(tan\) function has a period of \(π\), its values repeat after every \(π\) radian, and hence, the curve pattern repeats after every \(π\) radian. As we can see in the graph of the tangent function given below, the function has vertical asymptotes at \(x=-\frac{\pi \:\:}{2},\:\frac{\pi \:\:}{2},\:-\frac{3\pi \:\:}{2},\:\frac{3\pi \:\:}{2},\:\frac{5\pi \:\:}{2},…\).

Related to This Article
More math articles
- Full-Length GED Math Practice Test-Answers and Explanations
- Full-Length SAT Math Practice Test
- The Ultimate MCA Algebra 1 Course (+FREE Worksheets)
- The Complete Guide to 5 Best GED Math Study Guides
- Geometry in the Real World: How to Find Surface Area of Cubes and Prisms
- 10 Most Common 7th Grade MAP Math Questions
- Top 10 ALEKS Math Practice Questions
- How to Write Linear Functions from Tables
- 5th Grade FSA Math Practice Test Questions
- FTCE Math Practice Test Questions


What people say about "How to Graph the Tangent Function? - Effortless Math: We Help Students Learn to LOVE Mathematics"?
No one replied yet.