How to Graph Polynomial Functions

A step-by-step guide to Graph Polynomial Functions
Here is a step-by-step guide to graphing polynomial functions:
Step 1: Lay the Foundation
- Polynomial Anatomy: Revisit polynomial structures. Understand their general form: \(P(x)=a_{n}x^{n}+a_{n−1}x^{n−1}+…+a_{2}x^{2}+a_{1}x+a_{0}\).
- Terminologies: Reinforce the basics of degree, leading coefficient, zeros or roots, and end behavior.
Step 2: Recognize Polynomial Types
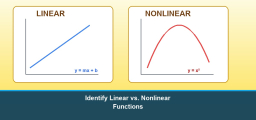
- Linear (Degree 1): It’s a straight line.
- Quadratic (Degree 2): Familiarize with the U-shaped parabola.
- Higher Degrees: Understand the potential wiggles and turns the graph might have; e.g., a cubic can have a single curve or an S-shape.
Step 3: Zeros or Roots
- Locate Zeros: These are the \(x\)-values where the function touches or crosses the \(x\)-axis. They play a pivotal role in shaping the graph.
- Factorization: Use techniques like factoring, the quadratic formula, or synthetic division to find zeros.
Step 4: Analyze End Behavior
- Degree & Leading Coefficient: These determine how the graph behaves as \(x\) approaches positive or negative infinity. Remember:
- Odd degree: Opposite ends.
- Even degree: Ends move in the same direction.
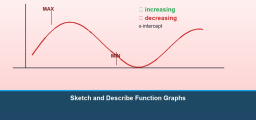
Step 5: Investigate Turning Points
- Maximum & Minimum: Understand that the graph can have high and low points between zeros. These can be found using calculus or by analyzing the nature of zeros and their multiplicities.
Step 6: Understand Intercepts
- \(X\)-intercepts: Points where the graph crosses or touches the \(x\)-axis (same as zeros).
- \(Y\)-intercept: Plug in \(x=0\) into your polynomial. The resulting value is where the graph crosses the \(y\)-axis.
Step 7: Use Symmetry

Original price was: $27.99.$17.99Current price is: $17.99.
Satisfied 1 Students
- Even Function: If replacing \(x\) with \(−x\) yields the same function, it’s symmetric about the \(y\)-axis.
- Odd Function: If replacing \(x\) with \(−x\) gives the negative of the function, it’s symmetric about the origin.
Step 8: Sketch the Graph
- Plot Intercepts: Begin by marking the \(x\)-intercepts and \(y\)-intercepts.
- Connect the Dots: Using the zeros, end behavior, turning points, and symmetry, sketch a preliminary shape of the graph.
- Refinement: Validate your sketch against the function itself. Adjust and modify as required.
Step 9: Utilize Technological Aids
- Graphing Calculators & Software: Tools like Desmos, GeoGebra, or a TI-84 can help visualize polynomial graphs.
- Digital Validation: Once you’ve sketched by hand, verify with digital tools. This can deepen comprehension and rectify potential errors.
Step 10: Continuous Practice
- Diverse Polynomial Equations: Regularly challenge yourself with a variety of polynomial equations. From simple linear equations to more complex, higher-degree polynomials.
- Real-world Applications: Relate polynomial graphs to real-world scenarios, enhancing understanding and relevance.
Final Words:
Mastering the art of graphing polynomial functions is akin to painting a vivid mathematical landscape, where each stroke (or step) brings the picture closer to life. As you internalize each step, remember that each polynomial graph tells a story, with its highs, lows, twists, and turns. Your task? To unravel, understand, and beautifully illustrate that narrative.

Related to This Article
More math articles
- 3rd Grade ACT Aspire Math Practice Test Questions
- How to Find Slope? (+FREE Worksheet!)
- Free Grade 6 English Worksheets for Massachusetts Students
- FREE 7th Grade SBAC Math Practice Test
- How to Define Sine, Cosine, and Tangent
- 7th Grade SBAC Math Worksheets: FREE & Printable
- Factoring Trinomials Worksheet with Answers
- Full-Length AFOQT Math Practice Test
- Reading and Writing Numbers in Different Forms for 4th Grade
- Prepare for the SAT Math: The Right Combination of Hard Work and Time Management


What people say about "How to Graph Polynomial Functions - Effortless Math: We Help Students Learn to LOVE Mathematics"?
No one replied yet.