How to Graph the Cosine Function?
Cosine is one of the primary mathematical trigonometric ratios. In this guide, you will learn more about the graph of the cosine function.
Graph the Cosine Function: what to notice and how to work it
What to notice first
Common student mistake
Key formulas and cues
A reliable path
- Choose the modelUse a right triangle, the unit circle, or a transformed graph.
- Track unitsConvert degrees and radians when needed.
- Use identitiesReplace complicated trig expressions with equivalent simpler ones.
Worked examples
Read a cosine rule
- Amplitude is |2|.
- Period is 2pi/4 = pi/2.
- Midline is y = 3.
Place parent cosine points
- Start at (0, 1).
- Use quarter-period steps.
- The y-values are 1, 0, -1, 0, 1.
Try one before moving on
Graph the Cosine Function: pop-up practice
A step-by-step guide to graphing the cosine function
Cosine is one of the primary mathematical trigonometric ratios. The cosine can be defined as the ratio of the length of the base to the length of the hypotenuse in a right triangle.
\(\color{blue}{cos\:x\:=\frac{Adjacent\:Side}{Hypotenuse}=\frac{Base}{Hypotenuse}\:}\)
where \(x\) is the acute angle between the base and the hypotenuse.
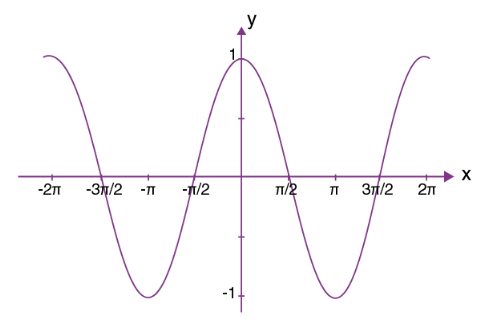
A cosine graph or \(cos\) graph is a top-down graph just like a \(sin\) graph. The only difference between a \(sin\) graph and a \(cos\) graph is that a sine graph starts at \(0\) while a cos graph starts at \(90\) (or \(\frac{\pi }{2})\). The \(cos\) plot given below starts at \(1\) and decreases to \(-1\) and then starts increasing again.


Related to This Article
More math articles
- Free Grade 5 English Worksheets for Arkansas Students
- 8th Grade ISASP Math Worksheets: FREE & Printable
- Package Inspection and Integrity
- Oklahoma OSTP Grade 5 Math: 48 Free Single-Page Printables, One Skill Each, Answer Keys Included
- GED Calculator
- How to Solve Pascal’s Triangle?
- Top 10 7th Grade ACT Aspire Math Practice Questions
- The Best Grade 6 ELA Practice Tests for Missouri Students
- Pythagorean Theorem Practice — Find the Missing Side (Free)
- The Best Grade 4 Math Book for Utah Students


What people say about "How to Graph the Cosine Function? - Effortless Math"?
No one replied yet.