Secondary Data Analysis: Find, Check and Analyze Data
Your paper is due in six weeks, and a 400-person survey won’t fit that timeline or your budget. The solution is secondary data analysis: you answer your research question using data someone else has already collected. Ready-made data has its own risks, so you need to know where to look and how to evaluate a source.
Secondary data analysis for term papers and theses: key insights
- Secondary data analysis answers a new question using data originally collected by someone else for a different purpose.
- Data.gov, the U.S. federal data portal, listed over 535,000 datasets in November 2026, so a term paper can often skip a new survey.
- Before you trust a table, check when the data was collected and how the respondents were selected.
- If a variable has an outlier, report the median as well as the mean, because the outlier distorts the mean.
Data analysis definition and how secondary research differs from primary
Data analysis is the process of cleaning, summarizing, and interpreting raw data to answer a specific question. If you’ve collected the data yourself via a survey or an experiment, you’re dealing with primary data. If you’re reusing data already collected by a statistics agency or another researcher, you’re doing secondary data analysis.
| Aspect |
Primary research |
Secondary research |
|---|---|---|
| Who collects the data | You | Someone else, often a statistics agency |
| Time to get the data | Weeks or months | Minutes to days |
| Control over questions | Full | None; you adapt to existing variables |
| Main risk | Too few respondents | Variables that don’t quite match your topic |
What ready-made datasets give you, and where their limits show up
The main benefit is scale. A national survey will cover far more households than any student project could. Sample size is therefore rarely your problem unless you filter down to a small subgroup. Many surveys repeat the same questions every year, so you can track change over time. On a tight deadline, secondary data analysis is often the only viable way to get a representative sample.
The main limit is control. Someone else picked the categories, so your variable may be “household income” rather than individual income. You also inherit any errors from the original data collection.
Where to find reliable data sources for secondary data analysis
Good data sources fall into four categories: government statistics, open datasets, scientific archives, and public web pages. Pick the one that actually measures your variable.
Government statistics and census tables
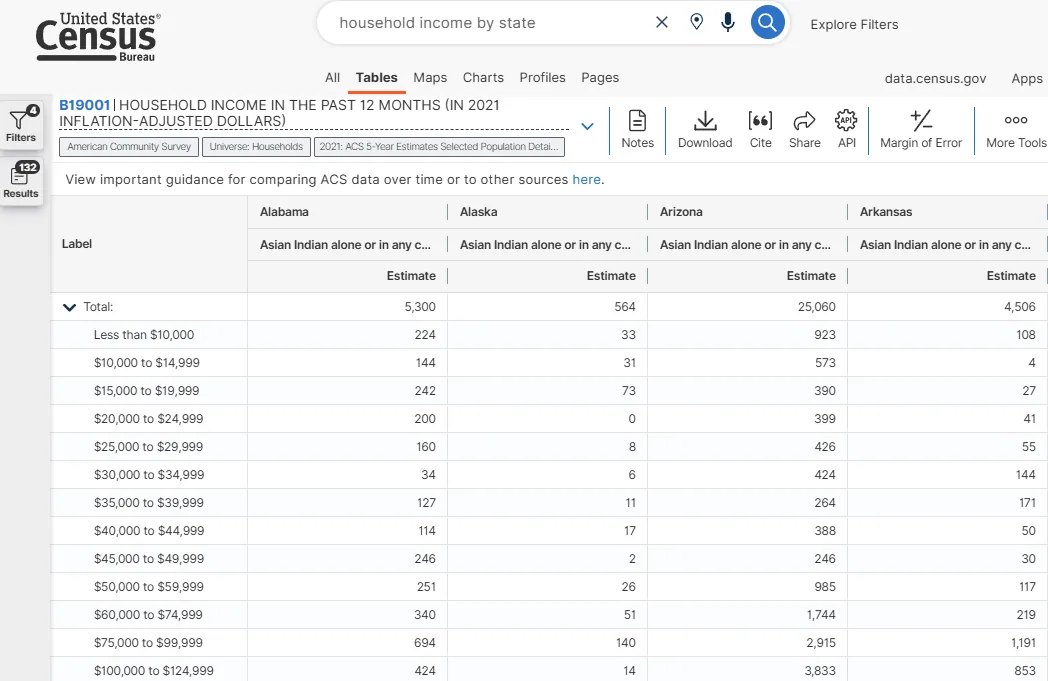
National statistics offices produce the most thoroughly documented tables. In the US, you’d normally go to the Census Bureau and the Bureau of Labor Statistics (BLS). Official figures always lag a little: the Census Bureau’s 2024 ACS 1-year estimates (American Community Survey) were published on September 11, 2025. They only cover areas with 65,000 or more residents.
Portals with open datasets
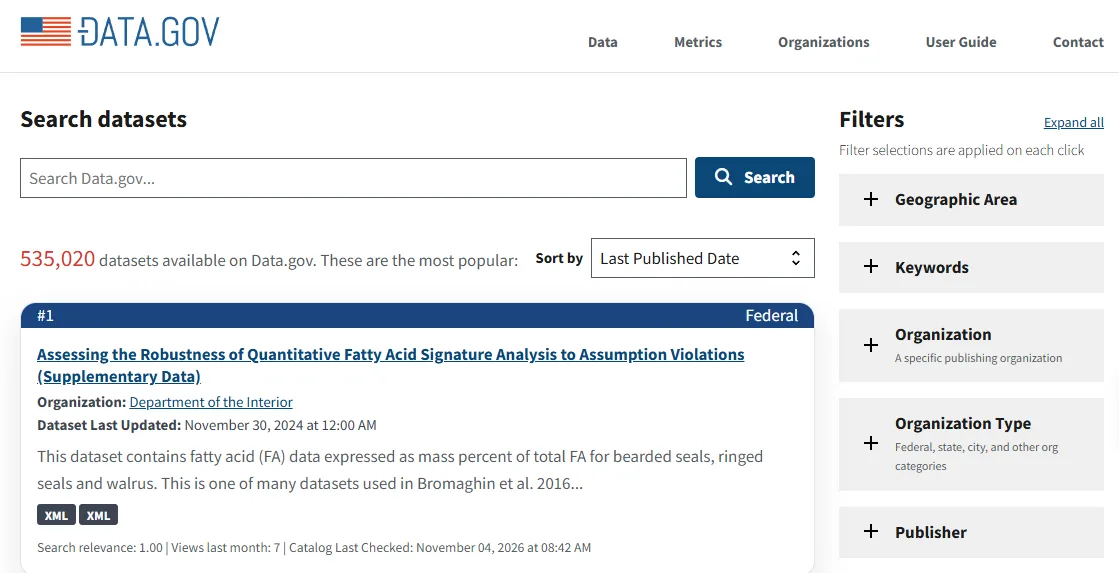
The federal catalog at Data.gov had 535,020 open datasets as of November 2026. Kaggle is also a useful community site, though many uploads are just copies of official tables, so trace each file back to its original publisher before you use it.
Scientific databases and replication archives
University archives such as ICPSR and Harvard Dataverse hold the individual-level records from published studies as well as codebooks describing how each variable was measured.
Public web pages with prices and ratings
Online prices and product ratings are perfectly valid material for a study. But the page you see could be quite different from the one everyone else sees. A January 2025 FTC staff study found that pricing intermediaries (middlemen hired by retailers) can use your browsing behavior, even your mouse movements, to set individualized prices. Because your browser stores your history and settings, the prices you see may reflect your profile, not what the average shopper would see. That bias skews your sample, so researchers often collect pages through a clean browser and a residential proxy. These steps can help control collection conditions, but they do not make the observed prices representative of all shoppers.
How to check data reliability before you build your paper on a source
Run these checks and record the answers, because they go straight into the Research Methodology section of your paper.
- Collection date. Note when the data was collected (not just when the report was produced).
- Sampling method. Find out how the participants were selected and what proportion responded.
- Completeness. Count the missing values in each variable you’re going to use.
- Definitions. Make sure a category such as “unemployed” means the same thing in every year you’re studying.
Note: Portals sometimes edit or delete files, so save your own copy and record the URL and retrieval date.
Secondary data analysis step by step: a data analysis example
The process below relies entirely on descriptive statistics, which are more than sufficient for most term papers.
- Narrow the research question down to the point where one variable can answer it. For example, “How many hours per week do part-time students work?”
- Pick a dataset that measures that variable directly and save its codebook.
- Remove the duplicate rows and recode the placeholder values (e.g. -9 or 999) as missing.
- Calculate the count, the mean, the median, the standard deviation, the minimum and the maximum.
- Describe the results in plain English and list the dataset’s limitations alongside them.
Worked example with eight survey responses
Suppose your extract from a public microdata file shows the weekly working hours of eight part-time students (illustrative figures): 12, 15, 15, 18, 20, 22, 25 and 45.
| Statistic |
Value |
What it tells you |
|---|---|---|
| Mean | 21.5 hours | The average, pulled up by the 45-hour case |
| Median | 19 hours | The middle value, closer to a typical student |
| Standard deviation (sample) | 10.4 hours | Work time varies widely around the average |
| Mean without the 45-hour case | 18.1 hours | One outlier shifted the result by 3.4 hours |
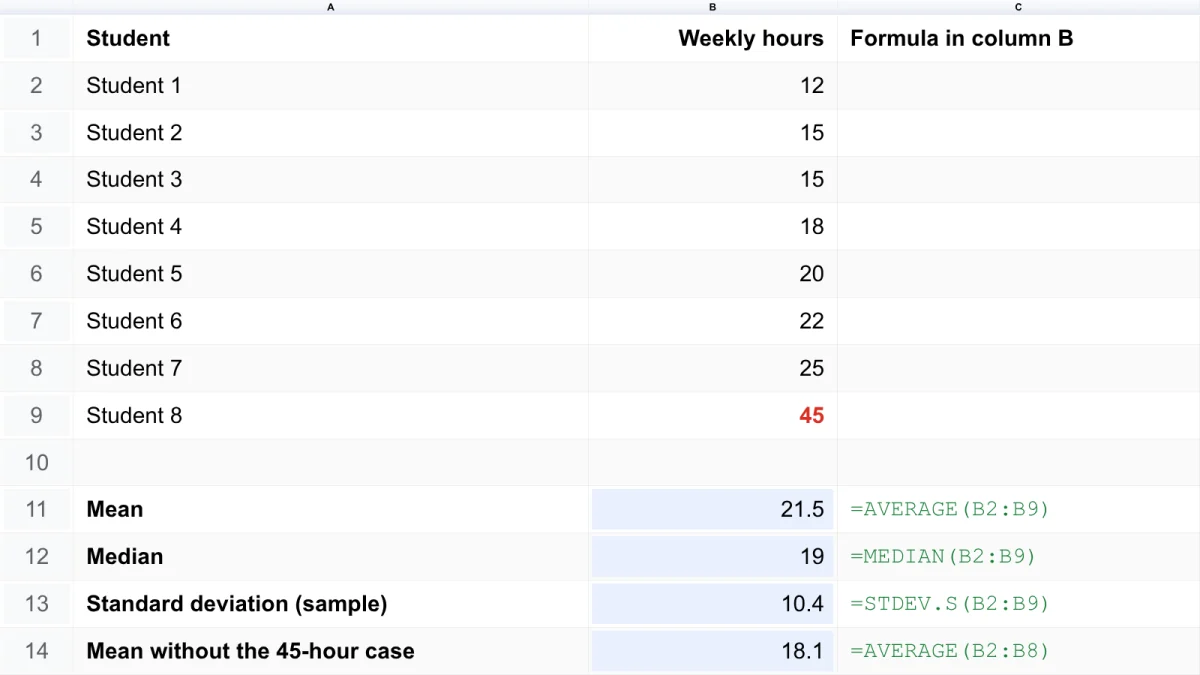
The mean is 2.5 hours above the median, which is a textbook case of right skew (one high value pulling the mean up). You’d report the median as your typical value and mention the outlier rather than delete it. Here’s how you’d work out the mean and the median:
The mean is the sum of all the values divided by the number of observations (172 ÷ 8 = 21.5).
The median is the middle value or, when the number of observations is even, the average of the two middle values: (18 + 20) ÷ 2 = 19.
The standard deviation calculator in sample mode gives you the 10.4 (10.3785) shown in the table. Sample mode is the right choice because these eight students are a sample from a larger population.
Choosing your first dataset for a term paper, thesis, or class report
Start with an official source that produces a codebook and keep your first secondary data analysis purely descriptive. If two sources conflict, go with the one that has the better methodology, not necessarily the more recent one.
Frequently asked questions about working with existing records
These are the questions students ask most often before they build a paper on existing data.
Is secondary data analysis acceptable for a thesis?
Yes. Much of the published work in economics and public health is based on existing surveys, and many universities accept a thesis built entirely on ready-made data. Your thesis committee will want to see that the dataset suits your topic and that you’ve dealt with its limitations. Describe the original sampling method, the year of collection, and any variables you recoded, so the committee can judge the quality of your secondary data analysis.
Do I need ethics approval for secondary data analysis?
Normally not for fully anonymized public files, although rules vary by institution. Individual-level health or education records may require ethics approval or a signed data use agreement, so it’s worth checking with your supervisor first. Even when no approval is needed, keep a note of where you downloaded the file, its terms of use, and the date you accessed it. Some archives, such as ICPSR, also ask you to cite the dataset in a specific format.
How many records do I need for a reliable result?
There’s no fixed cut-off, because the answer depends on how much your variable varies and how precise your estimate needs to be. Small subgroups give very unreliable estimates. If you filter a national file down to one city and one age group, you could be left with a few dozen rows. Your margins of error would then be enormous. Report the number of records behind every figure, so readers can judge its reliability themselves.
Can I combine two datasets in the same study?
Yes, if they share a common key (e.g. a county code) and use the same definitions. Merging across mismatched categories gives you numbers that look precise but are meaningless. Before you merge, check that both files cover the same years and geographic boundaries, because county lines and survey categories sometimes change. After merging, count the rows that failed to match and mention that number in your methodology section.

Related to This Article
More math articles
- How to Graph Functions
- How to Find the Integral of Radicals
- Home Equity Loan & HELOC Calculator (Payment & Borrowing Limit)
- Federalists vs. Anti-Federalists: Ratification and the Bill of Rights
- How to Match Word Problems with the One-Step Equations?
- Ratios, Concentrations, and Dilutions
- Pre-Algebra Survival Guide: Everything You Need to Pass in 2027
- Free Grade 7 English Worksheets for Louisiana Students
- Roman Numerals Converter (Number ↔ Roman, Free)
- How to Find Even and Odd Functions?





What people say about "Secondary Data Analysis: Find, Check, and Analyze Data"?
No one replied yet.