Math Tools That Help Students Organize Research Data

When it comes to schoolwork, gathering information is just the first step. The key to turning numbers into knowledge is to organize them well. That’s when math tools come in to help.
But which ones are worth your time?
Let’s look at the math tools that are most helpful for students who need to understand their research data, from spreadsheets to statistics software.
Why Do Students Need Math Tools to Help Them Organize Data?
Making tables and lists is only one part of organizing data. It’s about finding patterns, looking at different factors, and coming to a conclusion. Things can get messy quickly without the right tools.
Just as the right tools help students navigate complicated data, using dependable academic services can make overall workload management much easier. For this reason, many students turn to essay writing service reviews to find platforms that provide professional support with written assignments, allowing them to focus more time and energy on math-heavy courses and data-driven research.
Using Math Tools in Research Has Its Benefits
Math tools do more than just add and subtract; they help you organize and think logically. This is how they help:
- save time by not having to do calculations by hand;
- lower the risk of making mistakes;
- make it possible to see complicated relationships;
- make decisions based on data better;
- help with hypothesis testing and validation.
Now that we know what these tools can do for us, let’s look at them in more detail.
Spreadsheets: The Best Tool for Your Data
Microsoft Excel, Google Sheets, and LibreOffice Calc are some of the most useful math tools for students.
They are simple to use and very powerful once you learn how to use charts, functions, and formulas.
Common Features of Spreadsheets
Spreadsheets have a lot of built-in tools for organizing research data:
- Using sorting and filtering to handle big datasets.
- Formulas in math that do calculations on their own.
- Use conditional formatting to make patterns stand out.
- Use pivot tables to sum up data.
- Visual aids like charts and graphs.
You don’t have to be a data analyst to use these tools well. Even small things can make a big difference.
Use Case: Analyzing Survey Data
Let’s say you surveyed how students study. You can use spreadsheets to:
- answers to questions;
- find averages or percentages;
- make bar graphs to compare;
- filter answers based on certain criteria;
- find trends or outliers.
All of this can be done without knowing a lot about programming.
Statistical Software: Getting More Information from Data
When your research involves probability, regression, or hypothesis testing, a spreadsheet isn’t always enough.
That’s when statistical software comes in handy.
The Best Tools for Analyzing Statistics
Here are some well-known programs that students often use to work with more complicated data:
- SPSS is easy to use and great for social science research;
- R is open-source, can be changed to fit your needs, and is great for technical analysis;
- Stata is good with big datasets and is often used in economics;
- Jamovi is easy for beginners to use and has a clean interface;
- PSPP is a free alternative to SPSS that has many of the same features.
Each of these tools has its own strengths that depend on what you want to achieve with your project.
Important Functions of Statistical Software
You can use statistical tools to:
- Do regression analysis and correlation tests.
- Do both descriptive and inferential statistics.
- Make boxplots, scatter plots, and histograms.
- Make sure your data is reliable and valid.
- Make reports or graphs from the results.
They not only help you keep track of data, but they also help you understand it better.
Graphing Tools: Making Pictures Out of Numbers
Let’s be honest: most of us get visuals faster than plain numbers.
Graphing tools turn data into charts, diagrams, and plots that show patterns right away. These are very helpful for STEM projects or when giving a presentation on research.
Graphing Platforms That Are Helpful for Students
These are some great places where students can make math-based pictures:
- GeoGebra is an interactive math program that is great for graphs and geometry;
- Desmos is a web-based tool that is easy to use and good for plotting equations;
- ChartGo is a program that lets you make pie charts, bar graphs, and line charts;
- Tableau Public is a more advanced tool that is used by professionals to visualize data.
Graphing tools make it easy to see and understand, whether it’s a simple function or a complicated dataset.
Calculators and Equation Solvers on the Internet
There are times when you just need quick answers. You can use online math calculators to quickly solve equations, do statistical functions, or change data from one format to another.
You can usually get these tools for free and on any device.
A List of Common Online Math Tools
There are several online tools made just for students:
- equation solvers like Wolfram Alpha and Symbolab;
- statistical calculators (like Z-score and standard deviation);
- converters for units, like weight, length, and temperature;
- calculators for probability and combinatorics;
- tools for matrix and linear algebra.
They aren’t meant to take the place of your learning; they’re meant to help and check your work. But before you trust the results, make sure you know why they are what they are.
Using Tables, Lists, and Templates to Organize Data
Using structured layouts can help keep things neat and easy to find. When you want to compare variables or keep track of data over time, tables and lists are very helpful.
This is a simple table that compares some tools:
| Tool Type | Best For | Difficulty | Example Tools |
| Spreadsheets | Basic organization, quick math | Easy | Excel, Google Sheets |
| Statistical Software | Advanced analysis, testing | Medium | SPSS, R, Jamovi |
| Graphing Tools | Visualization, plotting equations | Easy | GeoGebra, Desmos |
| Online Calculators | Quick answers, verification | Easy | Wolfram Alpha, Symbolab |
Each tool can help with a different part of your research, like gathering data, making sense of it, and sharing what you find.
Each tool can help with a different part of your research, like gathering data, making sense of it, and sharing what you find.
How to Pick the Right Math Tool
There are so many options. How do you know which one to use? It depends on what you want to learn from your research, what kind of data you have, and how comfortable you are with math.
Let’s break it down.
Factors to Consider:
- Project requirements. Does your research need basic statistics or in-depth analysis?
- Complexity of data. Are you working with numbers, categories, or equations?
- Your math skills. Do you prefer simple interfaces or don’t mind learning new software?
- Tool accessibility. Is the tool free, open-source, or subscription-based?
- Collaboration features. Do you need to share or work with others in real-time?
Answering these questions will help you find the best fit for your work.
Use Math to Your Advantage
It doesn’t have to be hard to organize research data. You can make your work easier, make fewer mistakes, and get better results with the right math tools.
There is a tool for you, whether you need to make spreadsheets, look at statistics, or plot graphs.
The most important thing is to try different things and see what works best for your project. Once you do, math isn’t as much of a problem and is more of a way to get better research.
Frequently Asked Questions
What is the relationship between chord and arc?
In geometry, the relationship between a chord and its corresponding arc in a circle is quite direct: the chord is a line segment whose endpoints lie on the circle, and it bisects the arc into two equal parts. The larger the chord, the larger the arc it subtends, meaning a longer chord will cover more of the circle’s circumference. Understanding this relationship is crucial for students as it helps in solving various geometry problems and can also be useful in organizing and interpreting data involving circular measurements. This concept is a building block for more complex topics in geometry, which can be further explored through resources such as SHSAT Math preparation.
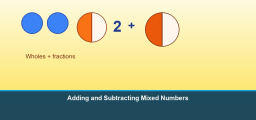
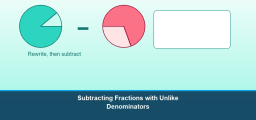
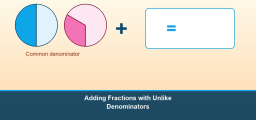
How do you add and subtract mixed fractions?
Adding and subtracting mixed fractions involve a few clear steps. First, ensure that the fractions have a common denominator. If they don’t, convert them so they do. Then, add or subtract the fractions while keeping the integer (whole number) part separate. After handling the fractional parts, combine the results with the whole numbers. This process mirrors organizing research data in that both require a structured approach to combining different elements to arrive at a clear conclusion. For more detailed steps and examples on handling fractions, you might find this guide on how to add and subtract fractions helpful.
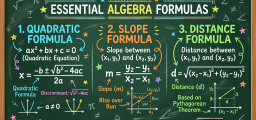
What is a quantitative formula?
A quantitative formula is a mathematical expression that quantitatively describes a relationship between variables. These formulas are crucial in organizing and analyzing research data, as they enable students to apply mathematical principles to draw meaningful conclusions from their data sets. For example, in the context of organizing research data, a student might use the formula for the mean (average) to analyze survey results or calculate statistical measures. Understanding how to apply these formulas not only aids in data organization but also enhances the student’s ability to interpret and present their findings effectively.

Related to This Article
More math articles
- Unlocking the Mystery of Inscribed Angles: A Complete Guide
- Full-Length PSAT Math Practice Test
- How to Prepare for the ALEKS Math Test?
- 7th Grade MCAS Math Worksheets: FREE & Printable
- Double the Steps, Double the Fun: How to Solve Two-Step Inequalities
- 5 Best AFOQT Math Study Guides
- The Ultimate Calculus Course
- The Ultimate MCAP Algebra 1 Course (+FREE Worksheets)
- Everything you Need to know about Limits
- How to Graph the Cosine Function?


What people say about "Math Tools That Help Students Organize Research Data - Effortless Math: We Help Students Learn to LOVE Mathematics"?
No one replied yet.