Ratio Tables

Ratio tables are used to represent and visualize a relationship between two separate quantities or items.
You have to use either division or multiplication to do a comparison.
Step-by-Step Guide to Read and Complete Ratio Tables
Ratio tables are a way to organize and compare data. They consist of rows and columns that show the relationship between different items or groups of items.
To use a ratio table, you first need to gather the data that you want to compare.
Then, organize the data into rows and columns, with each row representing a different item or group of items and each column representing a different aspect or category of the data.
Next, create a ratio by dividing one value in the table by another. These ratios can be used to compare the relative sizes or proportions of different items or groups of items.
Finally, you can use ratios to make conclusions or draw insights about the data.
- Understand the context of the table: Before you begin, read the title and any other information provided about the table to understand what data it contains and what it is trying to convey.
- Identify the rows and columns: Look at the table and identify the rows and columns. Each row represents a different item or group of items, and each column represents a different aspect or category of the data.
- Locate the data: Look for the data that is represented in the table. It is usually found in the cells of the table, where the rows and columns intersect.
- Create ratios: Divide one value in the table by another to create ratios. These ratios can be used to compare the relative sizes or proportions of different items or groups of items.
- Interpret the ratios: Compare the ratios to one another to draw conclusions or make inferences about the data.
- Look for patterns: Look for patterns or trends in the data. Are there any outliers or anomalies? Are there any relationships or correlations between different pieces of data?
- Draw conclusions: Use the information in the table to draw conclusions or make inferences about the data. Be sure to consider the context of the table and any other information you have about the data.
Note: The above steps are a general guide, and depending on the context, some steps may be omitted or added.
Ratio Tables – Examples 1
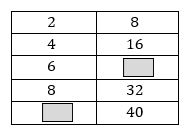
Complete the ratio table.
Solutions:
Step 1: Write the first ratio as a fraction. \(\frac{2}{8}\)
Step 2: Multiply the numerator and the denominator by the same number.
\(\frac{2}{8}=\frac{2×5}{8×5}=\frac{10}{40}\)
Step 3: Then apply steps 1 and 2 to find the next number.
\(\frac{2}{8}=\frac{2×3}{8×3}=\frac{6}{24}\)

Ratio Tables – Examples 2
Comparing the number of students in each grade level at a school
| Grade 6 | Grade 7 | Grade 8 | |
|---|---|---|---|
| Number of students | 50 | 60 | 70 |
In this table, the rows represent the grade levels and the columns represent the number of students in each grade level. To compare the number of students in each grade level, we can create ratios by dividing one number by another. For example, we can divide the number of students in grade 6 by the number of students in grade 7 to find out how many times as many students are in grade 6 as in grade 7.
Ratio Tables – Examples 3
Comparing the ratio of boys to girls in a class
| Boys | Girls | Total | |
|---|---|---|---|
| Number of students | 12 | 8 | 20 |
In this table, the rows represent the gender and the columns represent the number of students of each gender and the total number of students in the class. To compare the ratio of boys to girls, we can create ratios by dividing the number of boys by the number of girls or vice versa. We can also divide the number of boys by the total number of students to find out what proportion of the class are boys.
Example 4: Comparing the ratio of apples to oranges in a basket
| Apples | Oranges | |
|---|---|---|
| Number of fruits | 12 | 8 |
In this table, the rows represent the fruits and the columns represent the number of each fruit. To compare the ratio of apples to oranges, we can create ratios by dividing the number of apples by the number of oranges or vice versa.
You can use these examples as a guide, and adjust them to your specific lesson plan. Ratios tables are a great tool to help students understand the relationship between different values, and they can be applied to many different math concepts.
Related to This Article
More math articles
- Number Properties Puzzle – Challenge 19
- How to Find the x-Intercept of a Line?
- 6th Grade IAR Math Worksheets: FREE & Printable
- How to Graph Functions
- When do the ACT Scores Come out?
- How to graph Scatter Plots? (+FREE Worksheet!)
- Full-Length 7th Grade SBAC Math Practice Test-Answers and Explanations
- 6th Grade ACT Aspire Math Worksheets: FREE & Printable
- Top 10 5th Grade NYSE Math Practice Questions
- Intelligent Math Puzzle – Challenge 79


What people say about "Ratio Tables - Effortless Math: We Help Students Learn to LOVE Mathematics"?
No one replied yet.