How to Solve Systems of Equations Graphically?
Solving a linear equation means finding the value of the variables in it, and the graphical method is one of the methods for solving linear equations, either one or two variables linear equations. In this post blog, you learn how to solve systems of equations graphically.

Solve Systems of Equations Graphically: what to notice and how to work it
What to notice first
Common student mistake
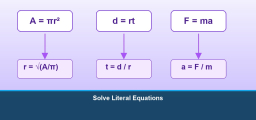
Key formulas and cues
A reliable path
- Choose a methodGraph, substitute, or eliminate depending on the form.
- Solve one variableUse the cleanest equation to find one value.
- Find and check the pairSubstitute back and verify both equations.
Worked examples
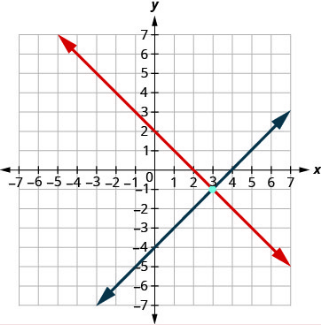
Substitution
- Set the right sides equal.
- Solve x + 2 = 2x – 1 to get x = 3.
- Substitute to find y.
Elimination
- Add the equations to eliminate y.
- 2x = 10, so x = 5.
- Use x + y = 8 to find y = 3.
Try one before moving on
Solve Systems of Equations Graphically: pop-up practice
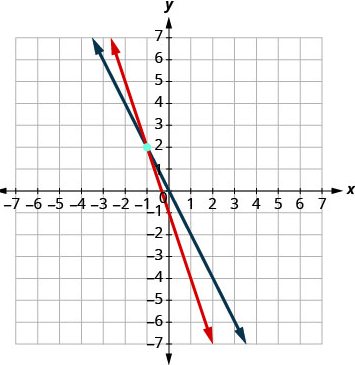
To solve a system of linear equations graphically, we draw both equations in the same coordinate system. The system solution will be at the point where the two lines intersect.
Related Topics
A step-by-step guide to solving systems of equations graphically
Linear equations are algebraic equations in which each sentence has a real constant and the equation consists of \(2\) variables with the highest power of \(1\). The linear equation is represented by \(y=mx + b\), also known as the \(y\)-intercept. Showing a linear equation on a graph is called graphing a linear equation, which is represented as a straight line with one or two variables.
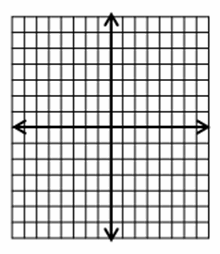
Graphing linear equations
Graphing a linear equation is about solving the linear equations and showing the solution in a coordinate plane. When drawing an equation on a graph, two pairs \((x, y)\) are sufficient. However, we can not know whether there are any mistakes in obtaining these values because the two points can always be joined and represented as a line. Hence, it is recommended to draw another point to ensure the solutions obtained for the given linear equation are correct.
To draw a linear equation with one variable, the following steps must be performed:
- Make sure the linear equation is in \(y\)-intercept form, which is \(y= mx+b\).
- Apply the trial and error method and find the value \((x, y)\) up to three pairs that satisfy the linear equation.
- Find the \(x\)-intercept and \(y\)-intercept of the equation. For \(y\)-intercept, substitute the value of \(x= 0\) in the equation. This results in \(x= a\), for \(x\)-intercept, substitute the value of \(y = 0\) in the equation. This results in \(y= c\).
- Therefore, the points are \((a, 0)\) and \((0, c)\). Make a tabular form and put the value of \(x\) and \(y\) respectively.
- Plot all the points on the graph paper.
- Combine all the points which are marked on the graph and you will get a straight line representing the given linear equation graphically.
Graphing linear equations in two variables
The graph of linear equations in two variables is done in a similar way to one variable. The lines drawn on the diagram can intersect at one point or be parallel to each other, resulting in no solution.
Sometimes, the lines might coincide with each other leaving each point on that line as a solution resulting in the given system having an infinite number of solutions. If the system has a solution, then it is said to be consistent; otherwise, it is said to be inconsistent.
The following steps are used to plot linear equations in two variables:
- To plot a linear equation with two variables, we draw both equations.
- To graph an equation manually, first convert it to the form \(y=mx+b\) by solving the equation for \(y\).
- Start putting the values of \(x\) as \(0, 1, 2\), and so on, and find the corresponding values of \(y\), or vice-versa.
- Identify the point where both lines meet.
- The point of intersection is the solution.
Exercises for Solving Systems of Equations Graphically
Solve each system by graphing.
- \(\color{blue}{\begin{cases}3x+y=-1\\ 2x+y=0\end{cases}}\)
- \(\color{blue}{\begin{cases}x+y=2\\ x-y=4\end{cases}}\)

- \(\color{blue}{\begin{cases}3x+y=-1\\ 2x+y=0\end{cases}}\)
- \(\color{blue}{\begin{cases}x+y=2\\ x-y=4\end{cases}}\)

Related to This Article
More math articles
- How to Use Models to Multiply Two Fractions?
- 10 Most Common 6th Grade NYSE Math Questions
- The 5 BEST Online Math Tutoring Tools
- Continental Drift, Plates, and the Evidence
- Life’s Fractional Challenges: How to Solve Word Problems on Adding and Subtracting Fractions with Different Denominators
- 2nd Grade Math Guide for Parents: What Your Child Should Master by 2026
- Weighted Average & GPA Calculator (Free)
- 10 Most Common 5th Grade FSA Math Questions
- Distance Measurement for 4th Grade
- 3rd Grade SBAC Math Practice Test Questions


What people say about "How to Solve Systems of Equations Graphically? - Effortless Math"?
No one replied yet.