How to Graph Logarithmic Functions?
You can graph the logarithmic function in a simple way. In the following guide, you learn how to graph logarithmic functions.

Logarithmic functions are closely related to exponential functions and are considered as an inverse of the exponential function. The exponential function \(a^x = N\) is transformed to a logarithmic function \(log _a\left(N\right)=x\).
Related Topics
A step-by-step guide to graphing logarithmic functions
Domain and range of logarithmic functions
We know that \(log x\) is defined only when \(x > 0\). So the domain is the set of all positive real numbers. We can see that \(y\) can be either a positive or negative real number (or) it can be zero as well. Thus, \(y\) can take the value of any real number.
Note:
- The domain of \(log\) function \(y = log x\) is \(x > 0\) (or) \((0, ∞)\).
- The range of any log function is the set of all real numbers \((R)\).
Logarithmic graph
We know that exponential and \(log\) functions are inversely proportional to each other, and so their graphs are symmetric concerning the line \(y = x\). Also, note that \(y = 0\) when \(x = 0\) as \(y=log _a\left(1\right)=0\) for any \(a\). Thus, all such functions have an \(x\)-intercept of \((1, 0)\). A logarithmic function doesn’t have a \(y\)-intercept as \(log _a\:0\) is not defined.
Properties of logarithmic graph
- \(a>0\) and \(a≠1\).
- The logarithmic graph increases when \(a>1\) and decreases when \(0<a<1\).
- The domain is obtained by setting the argument of the function greater than \(0\).
- The range is the set of all real numbers.
Graphing logarithmic functions
Before plotting the log function, just have an idea of whether you get an increasing curve or decreasing curve as the answer. If the \(base > 1\) then the curve is increasing, and if \(0 < base < 1\), then the curve is decreasing.
Here are the steps for graphing logarithmic functions:
- Find the domain and range.
- Find the vertical asymptote by setting the argument equal to \(0\). Note that a \(log\) function doesn’t have any horizontal asymptote.
- Substitute some value of \(x\) that makes the argument equal to \(1\) and use the property \(log _a\left(1\right)=0\). This gives us the \(x\)-intercept.
- Substitute some value of \(x\) that makes the argument equal to the base and use the property \(log _a\left(a\right)=1\) This would give us a point on the graph.
- Connect the two points (from the last two steps) and extend the curve on both sides relative to the vertical asymptote.
Graphing Logarithmic Functions – Example 1:
Graph the logarithmic function \(f\left(x\right)=2\:log _3\left(x+1\right)\).
Solution:
The base is \(3 > 1\). So the curve would be increasing.
The domain of the function is: \(x + 1 > 0 ⇒ x > -1\), so domain \(= (-1, ∞)\).
The range is \(= R\).
Vertical asymptote is \(x = -1\).
At \(x = 0\), \(y=2\:log _3\left(x+1\right)=2\:log _3\left(0+1\right)=2\:log _31=2(0)=0\)
At \(x = 2\), \(y=2\:log _3\left(x+1\right)=2\:log _3\left(2+1\right) =2\:log _33=2(1)=2\)
(If we want more clarity, we can make a table of values with random values of \(x\) and replace each one in the given function to calculate the values of \(y\). This way we get more points in the chart and it helps to complete the chart.)
Thus, \((0, 0)\) and \((2, 2)\) are two points on the curve. Thus, the \(log\) function graph looks as follows.

Exercises for Graphing Logarithmic Functions
Plot the following Logarithmic functions.
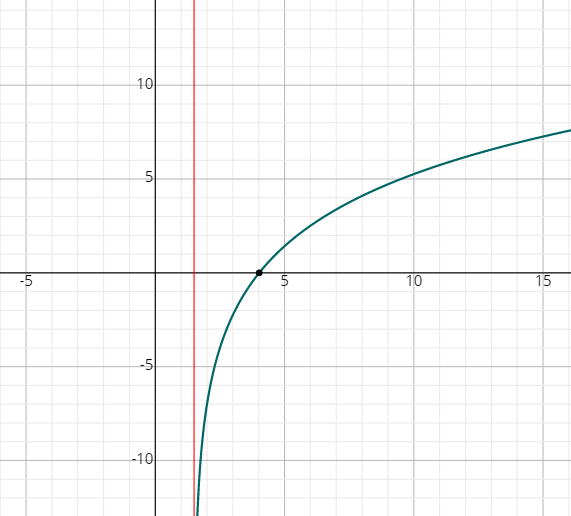
- \(\color{blue}{f\left(x\right)\:=\:3\:log _2\left(2x-3\right)-7}\)
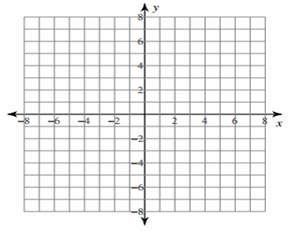
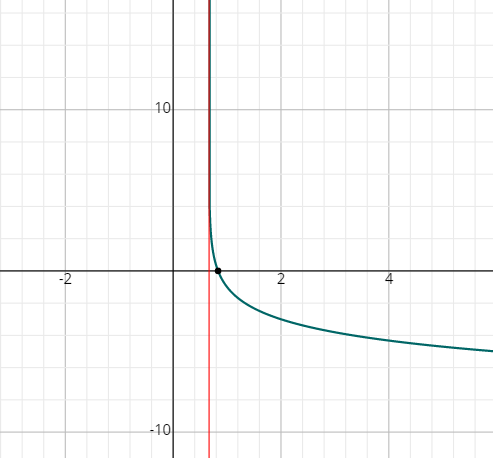
- \(\color{blue}{f\left(x\right)\:=\:-2\:log _4\left(6x-4\right)}\)


- \(\color{blue}{f\left(x\right)\:=\:-2\:log _4\left(6x-4\right)}\)
Related to This Article
More math articles
- Best Calculators For 12th Grade Students
- Converting Numbers Between Standard and Expanded Forms Up to a Billion
- 5th Grade AZMerit Math Worksheets: FREE & Printable
- How to Ace the GED Math Formulas
- The Ultimate 7th Grade GMAS Math Course (+FREE Worksheets)
- 10 Most Common 8th Grade PARCC Math Questions
- An In-depth Exploration of How to Find the Codomain
- Discover the Solutions: “ASTB Math for Beginners” Complete Solution Manual
- HiSET Testing Accommodations for Students with Disabilities
- Visualizing the Magic: How to Multiply Fractions Using Models




What people say about "How to Graph Logarithmic Functions? - Effortless Math: We Help Students Learn to LOVE Mathematics"?
No one replied yet.