How to Graph the Cosine Function?
Cosine is one of the primary mathematical trigonometric ratios. In this guide, you will learn more about the graph of the cosine function.

A step-by-step guide to graphing the cosine function
Cosine is one of the primary mathematical trigonometric ratios. The cosine can be defined as the ratio of the length of the base to the length of the hypotenuse in a right triangle.
\(\color{blue}{cos\:x\:=\frac{Adjacent\:Side}{Hypotenuse}=\frac{Base}{Hypotenuse}\:}\)
where \(x\) is the acute angle between the base and the hypotenuse.
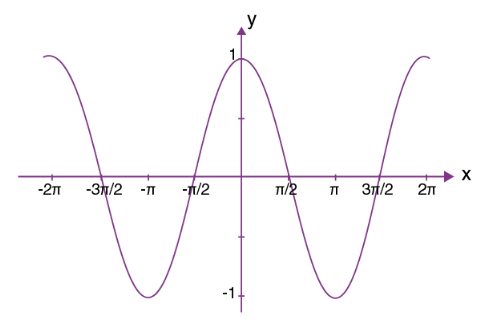
A cosine graph or \(cos\) graph is a top-down graph just like a \(sin\) graph. The only difference between a \(sin\) graph and a \(cos\) graph is that a sine graph starts at \(0\) while a cos graph starts at \(90\) (or \(\frac{\pi }{2})\). The \(cos\) plot given below starts at \(1\) and decreases to \(-1\) and then starts increasing again.


Related to This Article
More math articles
- How to Write the Standard Form of Linear Equations?
- Using Number Lines to Represent Fractions
- How to Solve Piecewise Functions?
- 3rd Grade IAR Math Practice Test Questions
- SIFT Math Practice Test Questions
- How to Multiply Radical Expressions? (+FREE Worksheet!)
- How to Estimate Limit Values from the Graph?
- What does PSAT Stand for?
- Grade 3 Vocabulary and Fluency: Build Word Power Without the Stress
- How to Solve Geometric Sequences? (+FREE Worksheet!)


What people say about "How to Graph the Cosine Function? - Effortless Math: We Help Students Learn to LOVE Mathematics"?
No one replied yet.