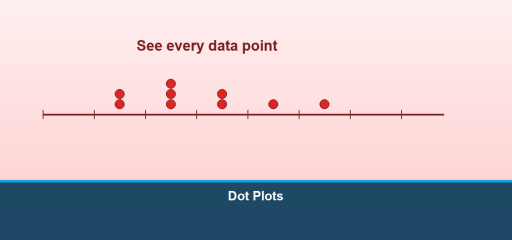
Grade 6 Math: Dot Plots
Build and read dot plots, describe clusters and spread, and connect visual displays to data questions.
Deciphering the Dots: How to Recognizing and Understanding Graph Patterns
TL;DR: Charts tell stories, and patterns are the plot. When you look at a graph, you are scanning for the shape of the data — trends rising or falling, clumps of points crowding together, lonely outliers, flat plateaus, sudden gaps, or rhythmic cycles. Spotting these patterns is the very first move in interpreting any chart […]