How to Graph the Cotangent Function?
Cotangent is one of the trigonometric ratios. In this step-by-step guide, you will learn more about the graph of the cotangent function.
Graph the Cotangent Function: what to notice and how to work it
What to notice first
Common student mistake
Key formulas and cues
A reliable path
- Choose the modelUse a right triangle, the unit circle, or a transformed graph.
- Track unitsConvert degrees and radians when needed.
- Use identitiesReplace complicated trig expressions with equivalent simpler ones.
Worked examples
Read a tangent graph rule
- The vertical stretch is 2.
- The period is pi/3.
- The midline is y = 1.
Find parent tangent asymptotes
- Place asymptotes at x = -pi/2 and x = pi/2.
- Plot the center point (0, 0).
- Draw an increasing branch between the asymptotes.
Try one before moving on
Graph the Cotangent Function: pop-up practice
Step-by-step guide to graphing the cotangent function
Cotangent is one of the basic trigonometric ratios. It is usually represented as \(cot x\), where \(x\) is the angle between the base and the hypotenuse of a right triangle. Alternative names of cotangent are cotan and cotangent \(x\).
The cotangent formula is:
\(\color{blue}{cot\:θ=\frac{Adjacent\:side}{Opposite\:side}}\)
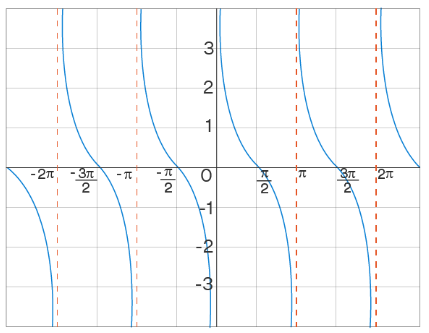
Since the cotangent function is not defined for integer multiples of \(π\), the vertical asymptote exists at all multiples of \(π\) in the cotangent graph. Also, the cotangent is \(0\) at all odd multiples of \(\frac{π}{2}\). Also, in an interval say \((0, π)\), the values of the cot decrease as the angles increase. So \(cot\) is a decreasing function. Then, the graph of the cotangent function looks like this.


Related to This Article
More math articles
- Top 10 Tips to Create a CHSPE Math Study Plan
- The Best Grade 8 Math Book for New Jersey Students
- The Ultimate 7th Grade NJSLA Math Course (+FREE Worksheets)
- 10 Most Common 4th Grade MCAS Math Questions
- The Best Grade 2 Math Worksheets for Kentucky Students
- The Best Grade 8 ELA Practice Tests for Washington Students
- Progressive Jackpot Math: When the Number Gets Big Enough to Matter
- Free Grade 8 English Worksheets for Texas Students
- Grade 6 Math: Area of Composite Figures
- Top 10 Tips to Overcome SHSAT Math Anxiety

What people say about "How to Graph the Cotangent Function? - Effortless Math"?
No one replied yet.