How to Compare Linear Functions Graphs and Equations

How to Compare Linear Functions Graphs and Equations is a multiple-choice math challenge from Effortless Math. Read the problem, choose from the answer options below, then open the solution to see the full step-by-step working and check your reasoning against it.
Quick answer: To compare linear functions, find the same two features for each one: the slope (rate of change) and the y-intercept (starting value). The larger slope grows faster, and the larger y-intercept starts higher. Example: y = 4x + 1 has slope 4, and a line through (−1, 0) and (0, 2) has slope 2, so y = 4x + 1 increases faster.
Comparing Linear Functions’ Graphs and Equations, Example 1:

(y=4x+1)
Solution: First, find the slope (m) of function (A). Find the change in (y) and the change in (x) points ((-1, 0)) and ((0, 2)) on the line: (m=frac{change in y}{change in x}: frac{0-2}{-1-0}=2). Now, find the slope of function (B). The equation of function (B) in the slope-intercept form is (y=4x+1). Therefore, its slope is equal to (4). In the final step, compare the slopes. The slope of function (B) is (4) and is greater than the slope of function (A(2)).
Exercises for Comparing Linear Functions’ Graphs and Equations
Compare the slope of function (A) and function (B)
function (A)
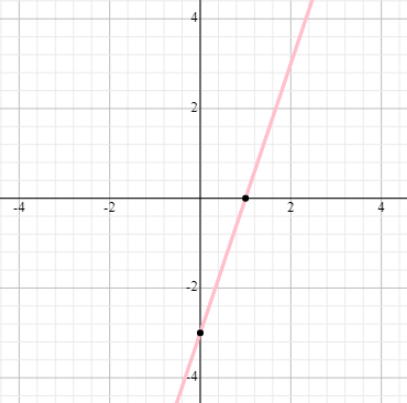
function (B)
(y=5x+5)

The slope of function (B) is (5) and is greater than the slope of function (A(3)).

How to Find Slope and Intercept in Each Form
| Form | Slope (rate of change) | y-intercept (start) |
|---|---|---|
| Equation y = mx + b | The number m in front of x | The constant b |
| Graph | Rise ÷ run between two points on the line | Where the line crosses the y-axis |
| Table | Change in y ÷ change in x between two rows | The y value when x = 0 |
| Word problem | The amount per unit, such as dollars per hour | The starting or fixed amount |
When a slope is negative, the line goes down. To compare steepness, compare the sizes of the slopes without their signs: a slope of −5 is steeper than a slope of 3.
Worked Example: A Table Versus an Equation
Function A is given by this table: when x is 0, 1, 2 and 3, y is 4, 7, 10 and 13. Function B is y = 2x + 6.
- Slope of A: y goes up 3 each time x goes up 1, so the slope is 3. The y-intercept is 4, the value at x = 0.
- Slope of B is 2, and its y-intercept is 6.
- Compare: B starts higher (6 is more than 4), but A grows faster (3 is more than 2).
- Where they meet: 3x + 4 = 2x + 6 gives x = 2. Both functions equal 10 there.
So B is greater before x = 2, they are equal at x = 2, and A is greater after that. This kind of reasoning answers questions like which phone plan or savings plan is better over time.
Frequently Asked Questions
How do you compare linear functions?
Find the slope and the y-intercept of each function, then compare them. The larger slope grows faster, and the larger y-intercept starts higher. For example, y = 3x − 2 has slope 3 and starts at −2. A table with points (0, 1) and (2, 5) has slope (5 − 1) ÷ (2 − 0) = 2 and starts at 1. The equation grows faster, but the table starts higher.
How do you compare functions on a graph?
Look at where each line crosses the y-axis, which line is steeper, and where the lines meet. The meeting point is where the functions have the same value. For y = x + 4 and y = 2x + 1, set x + 4 = 2x + 1 to get x = 3, so both equal 7 there. Before x = 3 the first line is higher; after it, the steeper line is higher.
How do you compare linear functions in tables, graphs and equations?
Turn each form into the same two numbers. In an equation y = mx + b, read m and b. On a graph, find rise ÷ run and the y-axis crossing. In a table, divide the change in y by the change in x; for rows (1, 7) and (3, 13) the slope is 6 ÷ 2 = 3, and working back one step of x gives the y-intercept 4.
How do you compare linear and nonlinear functions?
A linear function changes by the same amount for each equal step in x, so its graph is a straight line. A nonlinear function does not. In a table, check the differences: y = 2x + 1 gives 1, 3, 5, 7 for x = 0 to 3, always up by 2, while y = x² gives 0, 1, 4, 9, which goes up by 1, 3 and 5.
What is an example of comparing linear functions?
Suppose gym A charges a $30 fee plus $15 a month, y = 15x + 30, and gym B charges $20 a month with no fee, y = 20x. Gym B has the larger slope, and gym A has the larger y-intercept. Setting 15x + 30 = 20x gives x = 6, so both cost $120 after 6 months, and gym A is cheaper after that.

Related to This Article
More math articles
- Excess Capacity: Zero Profit, Markup and Minimum ATC
- Free Grade 3 English Worksheets for California Students
- How to Solve Multi-step Addition Word Problems
- The Best Grade 2 English Worksheets for Tennessee Students
- Fifteenth Amendment
- Full-Length 6th Grade IAR Math Practice Test
- The Best Grade 3 Math Book for Pennsylvania Students
- How to Understand Density of Real Numbers? (+FREE Worksheet!)
- How to Use Area Models to Multiply One-Digit Numbers By Two-digit Numbers
- How to Multiply Rational Expressions? (+FREE Worksheet!)










What people say about "Comparing Linear Functions: Graphs, Tables & Equations"?
No one replied yet.